
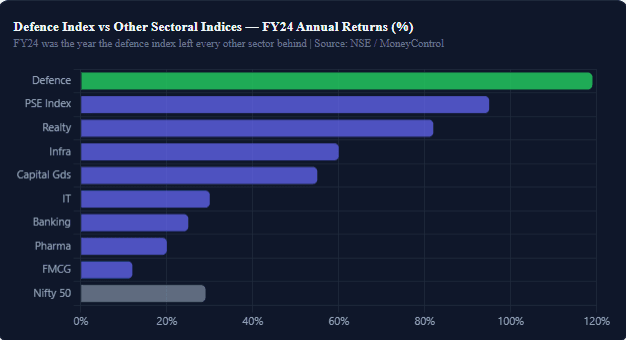
India’s defence index is no longer a niche corner of the stock market that only defence analysts watch. In FY24, the Nifty India Defence index delivered a staggering 119% return — the best of any sectoral index in India that year. high-risk turnaround comparison | In the risk-reward section More than half of its constituent stocks turned multibaggers. And the index has hit record highs multiple times since. “India’s gold reserve and defence expansion reflect the same strategic shift”
But most retail investors still do not fully understand how the defence index works — what stocks it contains, how they are weighted, why it moves when it does, and whether the current valuations still make sense for new investors in 2026. “CG Power is in both the defence index and India’s top semiconductor stocks”
This is the guide that fills that gap. You will get the complete picture: the index composition, each major stock’s role, the defence budget numbers that drive returns, historical performance data, how to invest via ETFs or direct stocks, the real risks, and the price targets analysts are working with right now. “the same infrastructure investment theme driving data center stocks in India also powers India’s defence index”
Defence Index Quick Snapshot — Nifty India Defence (May 2026)
- Index Name:Nifty India Defence Index (NSE)
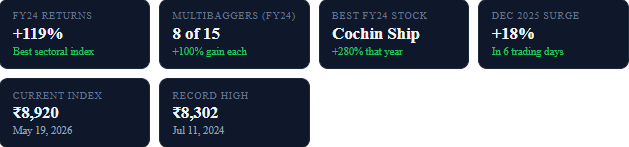
- Current Level:₹8,920.90 (as of May 19, 2026)
- FY24 Return:+119% — best sectoral index of FY24
- No. of Constituents:15 stocks (as of mid-2026)
- Largest Stock:BEL — Bharat Electronics Ltd (26% weight)
- 2nd Largest:HAL — Hindustan Aeronautics Ltd (24.35%)
- India Defence Budget FY26:₹6.21 lakh crore (+4.72% YoY)
- India Defence Exports FY25:₹23,622 crore (record high)
- Govt Target:$26 billion aerospace & defence manufacturing turnover
What Is the Defence Index? Definition, Purpose & Structure
Quick Definition (Featured Snippet):The defence index in India refers to the Nifty India Defence Index — a sectoral stock market index developed by NSE Indices Limited to track the performance of companies operating in India’s defence and aerospace sector. It includes stocks from the Nifty Total Market universe that either belong to eligible defence industries or derive at least 10% of their revenues from defence. The index is weighted by free-float market capitalisation and rebalanced semi-annually.
Why Was the Defence Index Created?
Before the Nifty India Defence index existed, investors who wanted defence sector exposure had no single tracking tool. They had to manually select and monitor individual stocks — HAL, BEL, Mazagon Dock, and others — without a benchmark to compare against. NSE Indices launched the defence index to provide a transparent, replicable benchmark that could be used for ETFs, index funds, and structured products. It also helps retail investors understand how the broad defence sector is performing without having to track 15+ individual stocks.
How Is the Defence Index Calculated?
The index uses the free-float market capitalisation methodology — the same approach used for Nifty 50 and most Indian sectoral indices. Free-float means only the shares available for public trading (not promoter-held shares) are counted in the weighting. This means a company with a large promoter stake (like most PSU defence companies, where the Government of India holds 55–70%) will have a lower index weight than its total market cap would suggest.
Eligibility Criteria for the Defence Index
- Must be part of the Nifty Total Market index
- Must belong to eligible defence basic industries or
- Must earn at least 10% of revenues from the defence sector
- Stocks are selected based on 6-month average free-float market capitalisation
- Index is rebalanced semi-annually (typically January and July)
Index Variants Available
- Nifty India Defence Index — Price Return version (standard)
- Nifty India Defence Total Returns Index (TRI) — includes dividend reinvestment; used for fund benchmarking
When you compare a defence index ETF’s returns against the benchmark, always check whether the fund uses the TRI (Total Returns) version — most fund factsheets now do, as it is the more accurate comparison.
Nifty India Defence Index: Full Composition & Weightages 2026
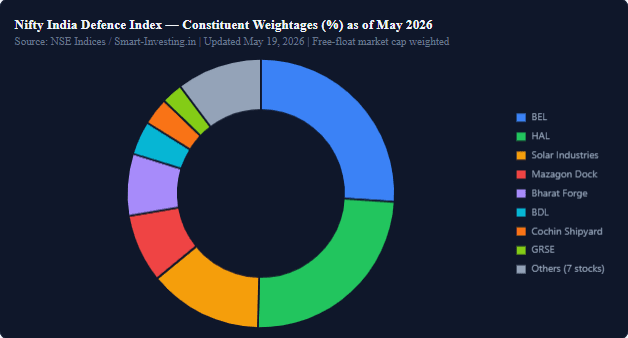
The defence index has 15 constituents as of mid-2026. The top 5 stocks account for over 79% of the total index weight — making this a highly concentrated index. Understanding who these companies are and what they do is essential before you invest in any defence index product.

Nifty India Defence Index — Full Constituent List & Weightages (May 2026)| # | Company | Ticker | Weight % | Sector Focus | PSU / Private |
|---|
| 1 | Bharat Electronics Ltd | BEL | 26.00% | Radar, Electronic Warfare, Communications | PSU |
| 2 | Hindustan Aeronautics Ltd | HAL | 24.35% | Fighter Jets, Helicopters, Aircraft | PSU |
| 3 | Solar Industries India | SOLARA | 13.77% | Explosives, Ammunition, Warheads | Private |
| 4 | Mazagon Dock Shipbuilders | MAZDOCK | 8.22% | Submarines, Warships, Naval Systems | PSU |
| 5 | Bharat Forge | BHARATFORG | 7.45% | Artillery, Defence Forgings, Vehicles | Private |
| 6 | Bharat Dynamics Ltd | BDL | 4.04% | Missiles, Torpedoes, Underwater Weapons | PSU |
| 7 | Cochin Shipyard Ltd | COCHINSHIP | 3.30% | Naval Vessels, Ship Repair, INS Vikrant | PSU |
| 8 | GRSE (Garden Reach) | GRSE | 2.56% | Warships, Survey Vessels, Patrol Boats | PSU |
| 9 | MTAR Technologies | MTARTECH | 1.76% | Precision Components, Nuclear, Aerospace | Private |
| 10 | Data Patterns India | DATAPATTNS | 1.71% | Defence Electronics, Radars, Avionics | Private |
| 11 | BEML Ltd | BEML | 1.28% | Defence Vehicles, Metro Rail, Mining | PSU |
| 12 | Zen Technologies | ZENTEC | 1.19% | Defence Simulation, Training Systems | Private |
| 13 | Apollo Micro Systems | APOLLOMICR | 1.02% | Defence Electronics, Missile Systems | Private |
| 14 | Astra Microwave | ASTRAMICRO | 0.87% | Microwave Components, Radar Systems | Private |
| 15 | Dynamatic Technologies | DYNAMATECH | 0.73% | Hydraulics, Aerospace Components | Private |
Key Insight: BEL + HAL alone = 50.35% of the defence index weight. The top 5 stocks = 79.79%. This concentration means the defence index is heavily influenced by just two PSU companies. When BEL and HAL perform well, the index performs well — and vice versa.
Top 7 Stocks in the Defence Index — Deep Analysis
You do not need to own all 15 stocks to understand the defence index. The top 7 by weight together represent over 87% of the index. Here is what each one actually does and why it matters.
1 BEL — Bharat Electronics Ltd (26% Weight)
BEL is the single most important stock in the defence index — with 26% weight, it has more impact on the index’s daily movement than any other constituent. BEL manufactures radar systems, sonar systems, electronic warfare equipment, night vision devices, communication systems, and satellite terminals for India’s Army, Navy, Air Force, and paramilitary forces.
BEL Key Metrics (FY26)
- Order Book: ₹71,650 crore — record high, multi-year revenue visibility
- Net Profit Growth: +31% YoY in FY26
- Analyst View: Maintained ‘Buy’ by Nuvama and Choice Institutional Equities
- Key Theme: Electronic warfare systems demand; missile guidance electronics; C4ISR (Command, Control, Communications, Computers, Intelligence, Surveillance, Reconnaissance)
- Export Push: BDL (missile exports) and BEL (radar exports) are jointly targeting Middle East and Southeast Asian markets
2 HAL — Hindustan Aeronautics Ltd (24.35% Weight)
HAL is India’s only aircraft manufacturer and the backbone of military aviation. It produces the LCA Tejas fighter jet (83 ordered by the Indian Air Force for ₹48,000+ crore), Advanced Light Helicopter (ALH Dhruv), Light Combat Helicopter (LCH), and maintains and upgrades the Air Force’s fleet of Russian-origin MiGs and Sukhois.
HAL Key Metrics (FY26)
- Order Book: ₹94,000 crore — largest order book in the defence index
- Revenue Trajectory: Strong first-half growth driven by LCA Tejas deliveries
- New Products: TEJAS MK1A, HLFT-42 jet trainer, and AMCA (Advanced Medium Combat Aircraft) in R&D pipeline
- Analyst View: Pre-Budget 2026 consensus — ‘Buy’; Sachin Gupta (Choice Broking) projected 12% upside on technicals
- Risk: Production ramp-up for Tejas MK1A has faced delays due to engine supply (GE F404) bottlenecks
3 Solar Industries India (13.77% Weight)
Solar Industries is the only private company in India’s top 3 defence index constituents. It is India’s largest manufacturer of industrial explosives — but its defence story is about ammunition, warheads, and rockets. Solar has been rapidly expanding into defence ammunition including 155mm artillery shells, hand grenades, rocket motors for missiles, and high-energy materials for DRDO projects.
- Stock at 52-week high: ₹18,653 — one of the index’s best performers in May 2026
- Defence revenue share: Rapidly growing from under 10% to over 25% of total revenue
- Key theme: India’s push to domestic-source all ammunition (currently heavily import-dependent)
4 Mazagon Dock Shipbuilders (8.22% Weight)
Mazagon Dock is India’s premier naval shipyard — located in Mumbai Harbour — and it builds submarines and warships exclusively for the Indian Navy. It is currently executing Project 75 (6 Scorpene submarines) and is likely to receive Project 75I (6 more advanced submarines) worth approximately ₹60,000+ crore.
- Revenue driver: Each submarine order takes 4–7 years to execute, creating long revenue visibility
- Stock catalyst: Naval contract optimism and Defence Acquisition Council (DAC) approvals consistently move this stock
- Recent performance: Soared 9% in January 2026 when DAC meetings approved new naval procurements
5 Bharat Forge (7.45% Weight)
Bharat Forge is India’s largest forging company and the only private-sector stock in the defence index’s top 5. It supplies artillery gun systems (ATAGS — Advanced Towed Artillery Gun System), armoured vehicle components, and naval propulsion forgings. Its defence revenue has grown from near-zero to approximately 15% of total revenues over 5 years.
6 Bharat Dynamics Ltd — BDL (4.04% Weight)
BDL is India’s dedicated missile manufacturer — it makes surface-to-air missiles, anti-tank guided missiles, torpedoes, and underwater weapons. Every missile launch by the Indian armed forces uses BDL-manufactured hardware. With India’s missile exports growing (Akash missile exports to friendly nations), BDL is a direct play on India’s defence export agenda.
7 MTAR Technologies (1.76% Weight)
MTAR is the smallest but arguably most dynamic stock in the top 7 of the defence index. It supplies precision components for ISRO rockets, nuclear reactors, and defence applications — and it is the only defence index company also exposed to the global clean energy boom through Bloom Energy fuel cells. Read our dedicated MTAR Technologies share price deep-dive for the full FY26 results and FY27 targets.
Historical Returns: How the Defence Index Has Performed

Defence Index Historical Performance vs Nifty 50| Period | Defence Index Return | Nifty 50 Return | Outperformance | Key Driver |
|---|
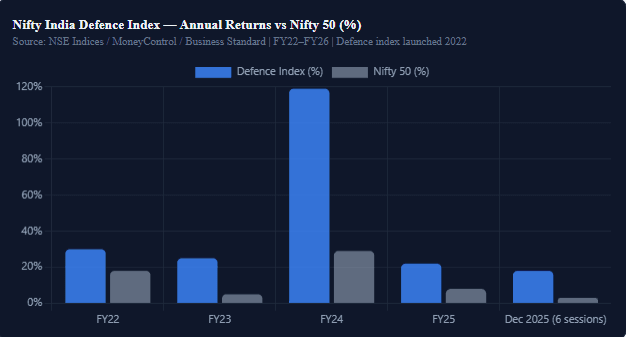
| FY22 (first year) | +30%* | +18% | +12% | Index inception; defence budget rise |
| FY23 | +25%* | +5% | +20% | Ukraine war; global rearmament sentiment |
| FY24 | +119% | +29% | +90% | Atma Nirbhar orders; PSU rerating; DAC approvals |
| FY25 | +22%* | +8% | +14% | Correction from FY24 peak; partial recovery |
| Dec 2025 (6-day surge) | +18% | +3% | +15% | DAC approvals; Budget optimism; BEL/HAL highs |
| Current (May 2026) | ₹8,920 level | — | — | Elevated but range-bound near all-time highs |
* Approximate figures for periods with limited data availability.
FY24: The 119% Year That Put the Defence Index on the Map
The Nifty India Defence index was the top-performing sectoral index of FY2023-24, gaining an impressive 119% from the previous year. More than half of its 15 constituents turned multibaggers. Government-owned Cochin Shipyard was the top index performer, gaining more than 280% in the year. Zen Technologies was a distant second with 191% gains.
Five PSU stocks — Mazagon Dock Shipbuilders, Hindustan Aeronautics, Bharat Electronics, Mishra Dhatu Nigam, and BEML — as well as Solar Industries and Astra Microwave jumped up to 189% during the year. Only two of 15 constituents underperformed: MTAR Technologies (+8%) and ideaForge Technologies (−46%).
The lesson from FY24: when the government’s defence procurement cycle accelerates, the defence index does not just outperform — it obliterates every other sectoral benchmark. The question for 2026 investors is whether another such cycle is building.

India’s Defence Budget: The Primary Engine Behind the Defence Index
Every rally in the defence index has one common upstream cause: India’s defence budget. Understanding the budget’s structure tells you which segments of the index benefit most and when.
India Defence Budget FY26: Key Numbers
India Defence Budget — FY26 Breakdown| Budget Head | FY26 Allocation | YoY Change | Defence Index Impact |
|---|
| Total Defence Budget | ₹6.21 lakh crore | +4.72% | Overall sector confidence |
| Capital Expenditure (Capex) | ~₹1.72 lakh crore | +Significant | Most important — directly funds weapon orders |
| Revenue Expenditure | Remainder | Salary & maintenance | Indirect — lower order impact |
| Defence Exports FY25 | ₹23,622 crore | Record high | Boosts private defence stocks |
| Govt Manufacturing Target | $26 billion | Long-term goal | Multi-year order pipeline |
Capital Expenditure Is What Moves the Defence Index
Of India’s total defence budget, the capital expenditure portion — roughly 25–30% of the total — is what matters most to the defence index. Capex funds new weapons, ships, aircraft, missiles, electronics systems, and vehicles. It is this portion that generates fresh purchase orders for BEL, HAL, Mazagon Dock, BDL, and the other index constituents.
The Defence Acquisition Council (DAC) approvals are the mechanism through which capex becomes actual orders. Every DAC meeting that grants Acceptance of Necessity (AoN) for a new procurement translates into order inflows for specific defence index companies within 6–18 months.
India’s Defence Export Ambition
In 2024-25, India’s defence exports reached ₹15,233 crore from the private sector and ₹8,389 crore from DPSUs (Defence Public Sector Undertakings), up from ₹15,209 crore and ₹5,874 crore in 2023-24. Total exports hit ₹23,622 crore in FY25. The government’s target is ₹50,000 crore by FY30. For private defence stocks like Solar Industries, Data Patterns, and MTAR, export revenue represents incremental upside not captured in domestic budget numbers.
For tracking the latest policy updates and defence procurement notices, the Ministry of Defence India official website is the authoritative source.
7 Reasons India’s Defence Index Is Rising in 2026
The defence index is not rising randomly. There are seven structural and cyclical reasons this sector continues to outperform the broader market.
1. Atma Nirbhar Bharat — 509+ Items on Positive Indigenisation List
The government has designated over 509 defence items that can only be procured domestically — not imported. This is a protected order pipeline for every company in the defence index. Each new item added to the list converts potential import spending into domestic procurement orders.
2. Record Order Books Across All Major Stocks
BEL has ₹71,650 crore in orders. HAL has ₹94,000 crore. Mazagon Dock is executing submarines. Each company in the defence index enters FY27 with more confirmed future revenue than any previous year — providing multi-year earnings visibility that justifies premium valuations.
3. Geopolitical Environment — China and Pakistan Border Tensions
India’s defence spending is driven by actual security needs. The Line of Actual Control (LAC) standoff with China and Pakistan’s ongoing modernisation are forcing India to accelerate procurement timelines. This is not discretionary spending — it is driven by strategic necessity. For defence index investors, geopolitical risk to India paradoxically increases the sector’s earnings visibility.
4. Global Rearmament Cycle
The rally followed strong gains in global defence stocks. Japan’s Nikkei 225 jumped 3.06%, with defence majors Kawasaki Heavy Industries and Mitsubishi Heavy Industries rising 5.7% and 6.4%. South Korea’s Kospi index gained 3.17%, led by Hanwha Aerospace and Poongsan. NATO countries hitting their 2% GDP target commitments and a global post-Ukraine rearmament cycle are creating a supportive global sentiment that lifts every domestic defence index.
5. Private Sector Entry: FDI Limit Raised to 74% Under Automatic Route
India raised the FDI limit in defence to 74% under the automatic route (and up to 100% through government approval). This is attracting global defence technology partnerships — Lockheed Martin, Boeing, Rafael, Airbus Defence — which co-develop with Indian companies, strengthening the order books of defence index private-sector companies.
6. Rising Defence Exports — ₹23,622 Crore in FY25
Defence exports have grown from virtually nothing to ₹23,622 crore in FY25. As India exports Akash missiles, Dhruv helicopters, ammunition, and small arms to friendly nations, defence index companies generate international revenue — reducing dependence on domestic budget cycles alone.
7. TCS/IT Sector Talent Migration to Defence Tech
Defence companies are increasingly hiring software engineers, AI specialists, and electronics designers — moving from pure hardware to smart weapons and digital warfare. Data Patterns, Zen Technologies, and BEL’s electronics warfare division are benefiting from this technology upgrading, which expands margins and product complexity.

How to Invest in the Defence Index: Step-by-Step Guide
There are three ways to get exposure to the defence index: through ETFs, through index funds, or through direct stock purchase in the constituents. Each has a different cost, flexibility, and minimum investment requirement.
Method 1 — Defence Index ETF (Recommended for Most Investors)
An ETF (Exchange Traded Fund) that tracks the Nifty India Defence index trades on NSE just like a stock — you can buy and sell in real time during market hours. It gives you exposure to all 15 defence index stocks in proportion to their weightages, with a single purchase.
Step-by-Step: How to Buy a Defence Index ETF
- Open a demat account with any SEBI-registered broker (Zerodha, HDFC Securities, ICICI Direct, Angel One, etc.)
- Search for defence ETFs — look for “Mirae Asset Nifty India Defence ETF” or “Motilal Oswal Nifty India Defence Index Fund”
- Check the ETF’s expense ratio — typically 0.35%–0.50% for defence ETFs; lower is better
- Check AUM and liquidity — a higher AUM and daily traded volume means lower bid-ask spread when you buy/sell
- Place a limit order (not market order) to avoid slippage on low-volume ETFs
- Review quarterly against the index, and rebalance if your allocation drifts beyond your target
Method 2 — Defence Index Fund (SIP Option)
Several AMCs offer defence and PSU sector funds that track or are benchmarked to the Nifty India Defence index. These allow SIP (Systematic Investment Plan) investment from as low as ₹500 per month — making defence index exposure accessible even without a large lumpsum. Use our SIP calculator to model what a monthly ₹5,000 SIP into a defence index fund would grow to over 10 years at historical CAGR rates.
Method 3 — Direct Stock Purchase in Index Constituents
If you want to overweight specific stocks — say, you believe BEL will outperform more than its 26% index weight suggests — you can build a custom defence index portfolio by buying individual stocks. The tradeoff: more work, higher transaction costs, and concentration risk if a single stock underperforms.
Practical Allocation Framework
| Approach | Minimum Investment | Expense Cost | Flexibility | Recommended For |
|---|
| Defence ETF | ~₹500–₹1,000 (1 unit) | 0.35–0.50% p.a. | High (buy/sell daily) | Most investors |
| Defence Index Fund | ₹500/month (SIP) | 0.50–1.0% p.a. | Medium (T+1 exit) | SIP investors |
| Direct Stocks | Price of 1 share of each | Brokerage only | Full control | Research-capable investors |
Calculate brokerage costs before executing large defence index stock purchases using our brokerage calculator. For F&O traders positioning in defence sector futures, the margin calculator shows the capital required.
Defence Index ETFs in India: Comparison Table
Defence Index ETFs & Funds Available in India (2026)| Fund Name | Type | Benchmark | Expense Ratio | SIP Available | Min. Investment |
|---|
| Mirae Asset Nifty India Defence ETF | ETF | Nifty India Defence TRI | ~0.35% | No (ETF) | ~₹500 (1 unit) |
| Motilal Oswal Nifty India Defence Index Fund | Index Fund (FOF) | Nifty India Defence TRI | ~0.50% | Yes ₹500/m | ₹500 |
| HDFC Defence Fund | Thematic Fund | Nifty India Defence TRI | ~0.90% | Yes | ₹1,000 |
| SBI Defence & Opportunities Fund | Thematic Fund | Nifty India Defence TRI | ~0.85% | Yes | ₹500 |
* Expense ratios are indicative as of 2026. Check AMC website for current figures before investing. Past performance is not indicative of future returns.
ETF vs Index Fund: Which Is Better for Defence Index Exposure?
- ETF advantage: Lower expense ratio, real-time pricing, intraday buying/selling, lower minimum investment per unit
- Index Fund advantage: SIP facility available, no demat account needed, easier for regular monthly investing, suitable for beginners
- ETF disadvantage: No SIP, need demat account, bid-ask spread on low-volume defence ETFs can be wide
- Verdict for long-term investors: If you have a demat account and can commit ₹5,000+ per purchase, the ETF’s lower expense ratio compounds into meaningful savings over 5–10 years. If you prefer SIP convenience, the index fund is perfectly fine.
Is the Defence Index Overvalued? Honest Assessment for 2026
This is the question every serious investor asks before putting money into the defence index at current levels. The honest answer: the defence index is expensive on trailing metrics, moderately reasonable on forward estimates, and potentially compelling over a 5-year horizon if order book execution tracks.
Valuation Snapshot: Defence Index Stocks
PE Ratios — Top Defence Index Stocks vs Broader Market| Stock | PE Ratio (TTM) | PE Range (Normal) | Valuation View |
|---|
| BEL | ~45–55x | 20–35x (historical) | Elevated, but order book justifies premium |
| HAL | ~35–45x | 18–30x | Above historical average; strong earnings growth |
| Solar Industries | ~65–80x | 30–50x | Very expensive; pricing in defence export optionality |
| Mazagon Dock | ~30–40x | 12–20x | High but submarine order backlog visible |
| Bharat Forge | ~40–55x | 20–35x | Diversified business; defence premium added |
| Nifty 50 avg | ~20–22x | — | Reasonable benchmark comparison |
Valuation Risk: The defence index trades at a significant premium to both historical levels and the broader market. This is justified only if the multi-year order books convert to revenue and profit growth on schedule. Any significant execution delay — Tejas MK1A engine supply, submarine construction timelines, government procurement pauses — could trigger a sharp re-rating. Use our
PE ratio calculator to model what happens to the stock price if earnings come in 20% below expectations at the current PE.
That said, defence stocks globally trade at structural premiums because of the predictability and long-term nature of government contracts. India’s defence index has demonstrated that when the execution cycle aligns with procurement cycles, the returns can be extraordinary — as FY24’s 119% proved.
Risks Every Defence Index Investor Must Know
Key Risk Summary for Defence Index Investors- Concentration risk: Top 5 stocks = 79% weight; BEL alone = 26%
- Government procurement delay risk: Budget allocation ≠ actual orders; timelines can slip by 1–3 years
- High PE multiples: Most stocks at 1.5–3x historical PE; any miss is painful
- PSU management risk: Government-run companies face bureaucratic decision-making
- Supply chain risk: HAL’s Tejas depends on GE F404 engines; international supply constraints exist
- Election/policy risk: Change in government or defence policy can realign procurement priorities
- Global peace risk: Geopolitical normalisation reduces defence urgency
The Single Biggest Risk: Order Book vs Revenue Recognition Gap
Defence companies often announce large order books — BEL’s ₹71,650 crore and HAL’s ₹94,000 crore look spectacular. But order book ≠ current revenue. Revenue recognition in defence happens upon delivery and acceptance — which can lag the order date by 2–7 years depending on the complexity of the product. Investors who confuse order book size with immediate earnings uplift often find themselves disappointed when quarterly revenue growth is slower than the headline order book growth suggests.
PSU vs Private Defence Stocks: Which Are Better for Defence Index Investors?
PSU vs Private Defence Stocks — Comparison| Factor | PSU Defence Stocks (BEL, HAL, MDL, BDL) | Private Defence Stocks (Solar, Bharat Forge, MTAR, Data Patterns) |
|---|
| Revenue predictability | High — government is the customer | Moderate — depends on tender wins |
| Order book visibility | Excellent — multi-year order backlogs | Good but less guaranteed |
| Margin quality | Lower — cost-plus pricing; no margin leverage | Higher — commercial pricing possible |
| Export potential | Growing — HAL, BDL missile exports | Excellent — Solar, MTAR already exporting |
| Management agility | Lower — PSU bureaucracy | Higher — faster decisions |
| Growth CAGR potential | 15–25% | 25–50% (higher risk) |
| Dividend income | Regular — government mandates PSU dividends | Lower or nil |
| FY24 multibagger count | 5 of 8 PSUs turned multibagger | 3 of 7 private turned multibagger |
Use our dividend calculator to calculate annual dividend income from PSU defence stocks. BEL, HAL, and Mazagon Dock all pay regular dividends — an income component many equity investors overlook when evaluating the full return from defence index stocks. Track actual stock returns from your purchase date using our stock return calculator.

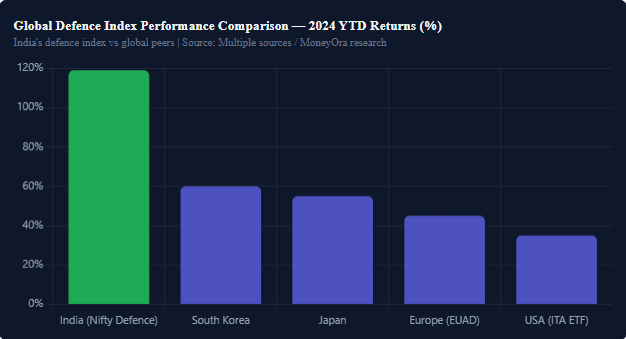
Global Defence Indices — Country Comparison| Country / Index | Key Stocks | FY24 Performance | Defence GDP % | Theme |
|---|
| India — Nifty India Defence | BEL, HAL, Solar, MDL | +119% | ~2.4% of GDP | Indigenisation + exports |
| USA — iShares Aerospace ETF (ITA) | Lockheed, RTX, Northrop | +35% | 3.5% of GDP | Global rearmament |
| Japan — Defence ETF | Kawasaki, Mitsubishi Heavy | +55% | Rising to 2% of GDP | Japan rearmament cycle |
| South Korea — Defence ETF | Hanwha Aerospace, Poongsan | +60% | 2.8% of GDP | Export success (Poland, UAE) |
| Europe — EUAD ETF | BAE Systems, Rheinmetall, Airbus D | +45% | NATO 2% target push | Ukraine-driven rearmament |
India’s defence index dramatically outperformed every major global peer in FY24. This is partly because it started from a lower base (India’s defence manufacturing was relatively immature vs US or European defence industries) and partly because domestic indigenisation policy created a unique protected procurement environment unavailable to global counterparts.
For context on how international monetary policy affects Indian investors who hold defence stocks, the Reserve Bank of India’s monetary policy page is the key resource — RBI rate decisions affect the cost of capital for high-PE defence stocks and the rupee’s movement, which in turn affects import costs for components.
MoneyOra Calculators for Defence Index Investors
Smart investing in the defence index requires financial discipline — on position sizing, return tracking, risk management, and portfolio balance. These free tools from MoneyOra help you make data-driven decisions:
For Defence Stock Analysis
For Risk Management
For Long-Term Portfolio Planning
- SIP Calculator — Model monthly SIP into a defence index fund over 5–10 years. Defence SIP works best for patient investors who can hold through procurement delays
- Lumpsum Calculator — Model a one-time investment in a defence ETF at 15%, 25%, or 40% CAGR scenarios
- SWP Calculator — Plan systematic withdrawal from defence index gains once your target is hit
- FD Calculator — Compare risk-free FD returns vs defence index’s higher-risk, higher-return profile
- RD Calculator — Safe savings as the risk-free foundation of your financial plan
- PPF Calculator — Tax-free long-term savings as portfolio anchor; balance high-risk defence index with PPF
- NPS Calculator — Retirement corpus planning alongside equity defence index allocation
- EPF Calculator — Provident fund balance as the bedrock of your financial security
Banking Tools
Conclusion: The Defence Index Is a Structural Theme, Not a Trade
India’s defence index is not a momentum play or a theme that lasts one budget cycle.
It is a structural re-rating story driven by one of the most significant policy shifts in independent India’s economic history:
the deliberate decision to build a domestic defence industrial base.
The numbers make the case. FY24’s 119% return.
BEL’s ₹71,650 crore order book.
HAL’s ₹94,000 crore backlog.
Defence exports hitting ₹23,622 crore.
509+ items on the indigenisation list.
And a $26 billion manufacturing target that India has the infrastructure to actually achieve.
At the same time, the valuations are not cheap.
BEL at 50x, Solar Industries at 75x, HAL at 40x — these prices assume execution.
If government procurement cycles slip or global geopolitics normalise, the premium attached to every defence index stock will compress fast.
The right approach: allocate a defined percentage of your equity portfolio to the defence index (10–15% is a commonly cited figure by financial planners for thematic sector exposure), invest through SIP rather than lumpsum to average price, and hold with a 5+ year horizon. The defence index is not a trading vehicle — it is a patient investor’s compounding machine.
Start Investing in India’s Defence Index
Use MoneyOra’s free tools to plan your defence index investment:
Disclaimer: This article is for informational and educational purposes only and does not constitute investment advice. All data is sourced from NSE Indices, company filings, and public market information as of May–June 2026. Defence index investments carry market risk. Past performance is not indicative of future results. Please consult a SEBI-registered investment advisor before making investment decisions.


Pingback: MTAR Technologies Share Price Soars 260% in a Year
Pingback: Share Market Today: Will Nifty & Sensex Continue Their Bull Run This Week 26? - MoneyOra
Pingback: AI Stocks Picks 2026: Next 5 Best Multibagger AI Stocks
Pingback: Gold Reserve in India Hits 880 Tonnes: Why Is RBI Bringing Gold Back Home - MoneyOra
Pingback: Reliance Power Share: Honest Analysis After Q4 FY26 Results
Pingback: Best Green Hydrogen Stocks in India 2026 - MoneyOra