MTAR Technologies share price has been one of the biggest stories on Indian stock markets in 2026. From a 52-week low of ₹1,347 in August 2025, the stock climbed past ₹8,299 in late May 2026 — a gain of over 500% in roughly nine months. Whether you are tracking this stock for the first time or you have held it through the dips, this guide covers everything: what the company actually does, where the price has been, what drove the recent rally, and what analysts expect going ahead
What is MTAR Technologies?
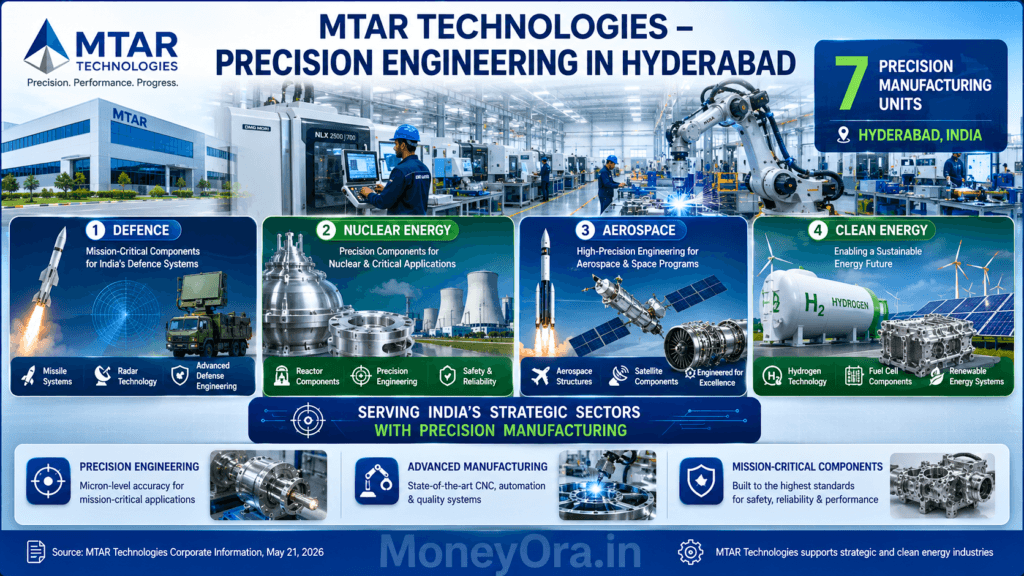
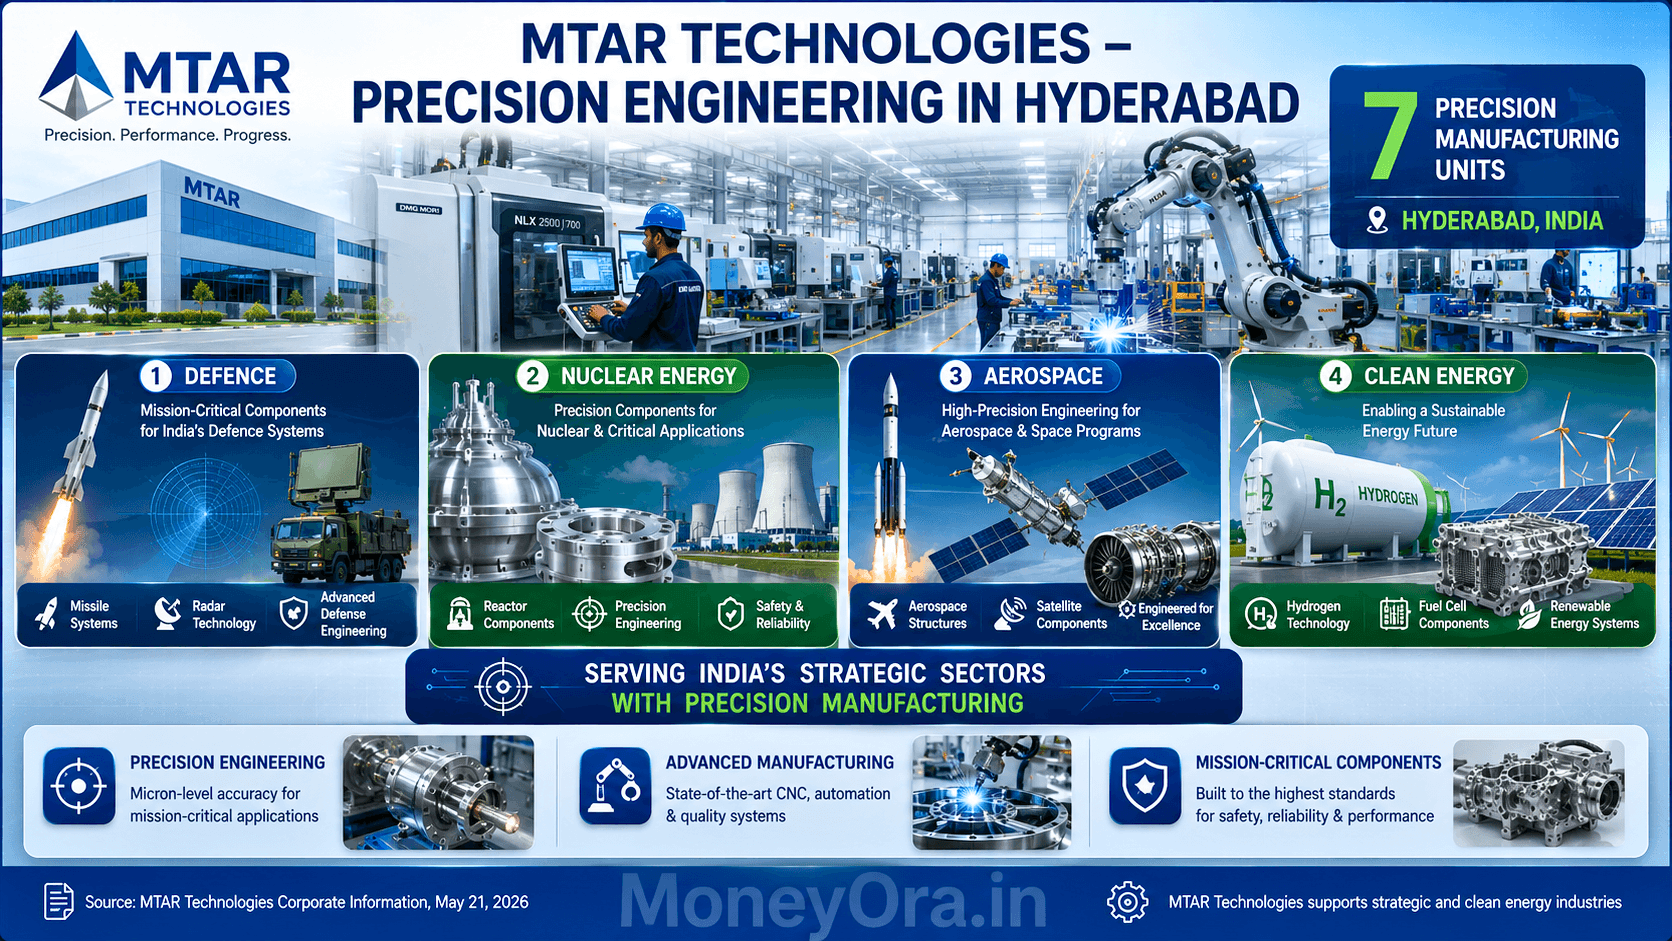
MTAR Technologies Limited (NSE: MTARTECH, BSE: 543270) is a Hyderabad-based precision engineering company founded in 1970 by PR Reddy, KSN Reddy, and PJ Reddy. The company was set up to supply critical engineered components to the Indian government when defence and nuclear imports were restricted. Over five decades it has grown into one of the few Indian manufacturers capable of making ultra-precision assemblies for nuclear reactors, space launch vehicles, defence platforms, and clean energy fuel cells.
Seven manufacturing units in Hyderabad — all within a 4-kilometre radius — plus a dedicated export facility handle production. The company also makes specialised products like ball screws, water-lubricated bearings, roller screws, electro-mechanical actuation systems, and ASP assemblies. In short, MTAR makes things that other Indian companies cannot easily make, which gives it pricing power and long-duration contracts. “compare MTAR with other top AI stocks in India”
MTAR went public in March 2021 at an issue price of ₹575 per share. The IPO was oversubscribed by a large margin, reflecting early investor confidence in the company’s order pipeline from organisations like ISRO, DRDO, and international energy firms. “Netweb Technologies India — another high-growth Make in India stock worth studying”

MTAR Technologies share price today (May 2026)
As of 25 May 2026, the MTAR Technologies share price is trading around ₹4,941 on NSE after a sharp consolidation from the intraday high of ₹8,299 touched on 22 May 2026. The stock remains up over 260% on a one-year basis — one of the strongest performances in the Nifty India Defence index this year.
| Data Point | Value (as of 25 May 2026) |
|---|
| Current Price (NSE) | ₹4,941 |
| 52-Week High | ₹8,299 (22 May 2026) |
| 52-Week Low | ₹1,347.80 (Aug 2025) |
| Market Cap | ~₹15,189 crore |
| P/E Ratio (TTM) | ~213x |
| EPS (TTM) | ₹21.19 |
| Book Value per Share | ₹243 |
| Debt-to-Equity | 0.25 |
| Face Value | ₹10 |
| Exchange | NSE & BSE |
The stock’s journey from under ₹1,400 to nearly ₹8,300 in nine months looks dramatic, but it happened in distinct waves tied to specific catalysts — Q4 FY26 results, Bloom Energy’s massive Oracle deal, and a clutch of large defence and nuclear orders. The current pullback from ₹8,299 to around ₹4,941 likely reflects some profit-booking after the rapid run-up rather than any change in fundamentals. “MTAR is part of India’s Nifty India Defence index — see the full index guide”
MTAR Technologies Revenue & Profit: 10-Year Financial Performance
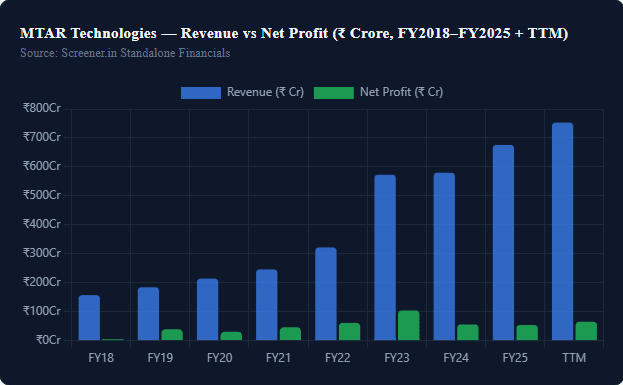
Understanding why MTAR Technologies share price trades at 224x earnings requires looking at both the extraordinary revenue growth and the earnings inconsistency. These two facts coexist.
MTAR Technologies — Revenue vs Net Profit (₹ Crore, FY2018–FY2025 + TTM)
Source: Screener.in Standalone Financials

Sales Growth: Compounded and Consistent at the Top Line
MTAR Technologies — Annual Revenue & Net Profit (₹ Crore)| Year | Revenue (₹ Cr) | Net Profit (₹ Cr) | OPM % | EPS (₹) |
|---|
| FY2018 | 157 | 5 | 20% | 1.92 |
| FY2019 | 184 | 39 | 29% | 13.89 |
| FY2020 | 214 | 31 | 27% | 11.70 |
| FY2021 | 246 | 46 | 34% | 14.98 |
| FY2022 | 322 | 61 | 29% | 19.79 |
| FY2023 | 573 | 104 | 27% | 33.84 |
| FY2024 | 580 | 56 | 19% | 18.29 |
| FY2025 | 676 | 54 | 18% | 17.51 |
| TTM (FY26E) | 753 | 65 | 19% | 21.19 |
Sales Growth CAGR — The Impressive Numbers
- 10-Year Sales CAGR: 24%
- 5-Year Sales CAGR: 26%
- 3-Year Sales CAGR: 28%
- TTM Sales Growth: 18%
Profit Growth CAGR — Where the Complexity Lies
- 10-Year Profit CAGR: 30% — excellent long run
- 5-Year Profit CAGR: 11% — much lower; FY24/FY25 drag
- 3-Year Profit CAGR: −4% — negative; earnings compressed
- TTM Profit CAGR: +52% — recovery underway
Why Did Profits Fall in FY2024–FY2025 Despite Revenue Growth?
Revenue grew from ₹573 crore (FY23) to ₹580 crore (FY24) to ₹676 crore (FY25) — steady progress. But profit crashed from ₹104 crore in FY23 to ₹56 crore in FY24 and ₹54 crore in FY25. Three factors explain this:
- OPM compression: Operating margin fell from 27% (FY23) to 19% (FY24/25) as raw material costs and employee costs rose faster than billing rates
- Interest cost jump: Borrowings rose from ₹143 crore (FY23) to ₹190 crore (FY24) and ₹177 crore (FY25) — interest charges roughly doubled to ₹22 crore annually
- Depreciation increase: Heavy capex (fixed assets grew from ₹282 crore in FY23 to ₹425 crore in FY25) raised annual depreciation from ₹18 crore to ₹32 crore
What This Means for MTAR Technologies Share Price
The market is not pricing the current ₹54 crore net profit — it is pricing the ₹300–₹400 crore profit it expects MTAR to generate by FY27–FY28 if the 50% revenue growth guidance is delivered and margins recover. That forward bet is the entire justification for the 224x PE. Whether it is right depends almost entirely on the Bloom Energy order flow and nuclear reactor programme timeline.
Quarterly Results: Quarter-by-Quarter Breakdown
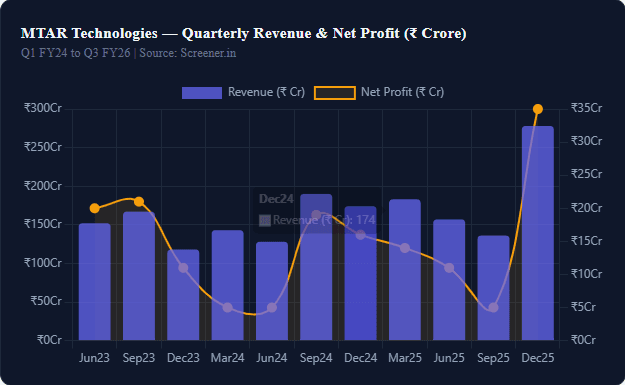
The quarterly pattern in MTAR Technologies is erratic — a natural feature of a defence and engineering company with lumpy order execution. But the most recent quarter (Dec 2025) was the standout.
MTAR Technologies — Quarterly Revenue & Net Profit (₹ Crore)

MTAR Technologies — Quarterly Financial Data (₹ Crore)| Quarter | Revenue | Operating Profit | OPM% | Net Profit | EPS (₹) |
|---|
| Jun 2023 | 152 | 34 | 22% | 20 | 6.44 |
| Sep 2023 | 167 | 36 | 22% | 21 | 6.77 |
| Dec 2023 | 118 | 24 | 20% | 11 | 3.43 |
| Mar 2024 | 143 | 18 | 13% | 5 | 1.65 |
| Jun 2024 | 128 | 16 | 13% | 5 | 1.48 |
| Sep 2024 | 190 | 37 | 19% | 19 | 6.11 |
| Dec 2024 | 174 | 33 | 19% | 16 | 5.31 |
| Mar 2025 | 183 | 34 | 19% | 14 | 4.62 |
| Jun 2025 | 157 | 28 | 18% | 11 | 3.65 |
| Sep 2025 | 136 | 17 | 13% | 5 | 1.49 |
| Dec 2025 | 278 | 64 | 23% | 35 | 11.43 |
Dec 2025 Quarter: The Breakout
The Dec 2025 quarter was transformational. Revenue jumped to ₹278 crore — the highest single quarter in MTAR’s history — up 60% from the same quarter a year earlier. Operating profit hit ₹64 crore (23% OPM), and net profit was ₹35 crore. EPS of ₹11.43 in a single quarter is more than MTAR earned in all of FY2024. This quarter is what lit the MTAR Technologies share price fuse.
What Drove the Dec 2025 Surge?
- Significant shipments of Bloom Energy hot box assemblies under the expanded Oracle-linked order cycle
- Nuclear reactor component deliveries for the Fast Breeder Reactor programme
- Defence component deliveries that had been deferred from earlier quarters
- Improved operating leverage — revenue scale finally exceeded the fixed cost base built through FY23–FY25 capex
Shareholding Pattern: Who Is Buying MTAR Technologies?
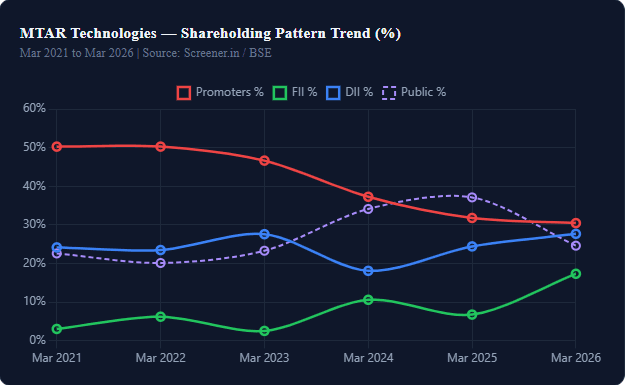
MTAR Technologies — Shareholding Pattern (%) as of Mar 2026| Investor Category | Mar 2021 | Mar 2023 | Mar 2025 | Mar 2026 | Change (5Y) |
|---|
| Promoters | 50.25% | 46.63% | 31.77% | 30.44% | −19.81 pp |
| FIIs (Foreign) | 3.02% | 2.51% | 6.74% | 17.31% | +14.29 pp |
| DIIs (Domestic) | 24.14% | 27.57% | 24.40% | 27.66% | +3.52 pp |
| Public / Retail | 22.58% | 23.28% | 37.10% | 24.59% | +2.01 pp |
The Promoter Selling Story — Red Flag or Normal?
Promoter holding has fallen from 50.25% (Mar 2021) to 30.44% (Mar 2026) — a decline of nearly 20 percentage points in five years. That is a significant reduction. Screener’s analysis flags this as a concern. Whether it is a red flag depends on the reason: promoters selling at high valuations to monetize personal wealth is different from selling due to loss of conviction.
FII Surge: Institutional Vote of Confidence
Foreign Institutional Investors have sharply increased their MTAR stake — from just 3.02% in March 2021 to 17.31% in March 2026. This is a significant positive signal. FIIs typically conduct deep due diligence before building large positions in small and mid-cap stocks. The FII surge suggests global institutional money sees MTAR’s clean energy and defence exposure as worth paying for at current levels.
Mutual Funds Holding MTAR
Four mutual funds hold MTAR positions as of the latest data: Sundaram Small Cap Fund (4.06% of its AUM in MTAR), HSBC Infrastructure Fund (2.40%), HSBC Small Cap Fund (1.95%), and Franklin India Small Cap Fund (1.59%). Mutual fund interest has grown, adding another institutional layer to the ownership mix.
MTAR Order Book & Revenue Visibility: FY26–FY27
An order book is the clearest forward revenue indicator for an engineering company. MTAR has guided for an order book of ₹2,800 crore by FY26. Management has also confirmed 50% revenue growth in FY27. Let us break down what is inside that order book.
Order Book Composition
MTAR Technologies — Estimated Order Book Breakdown FY26| Segment | Estimated Share | Key Client / Project | Revenue Trigger |
|---|
| Clean Energy (Bloom Energy) | ~50–55% | Bloom Energy (Oracle 2.8 GW deal) | Hot box shipments FY26–FY28 |
| Nuclear Energy | ~20–25% | NPCIL – Fast Breeder Reactor | FBR Stage 3 prototype completion |
| Defence & Aerospace | ~15–20% | DRDO, ISRO, HAL | Ongoing defence budget cycle |
| Data Centre / Other | ~5–10% | International data centre energy | ₹35.56 Cr order secured Apr 2026 |
Revenue Guidance: 50% Growth in FY27
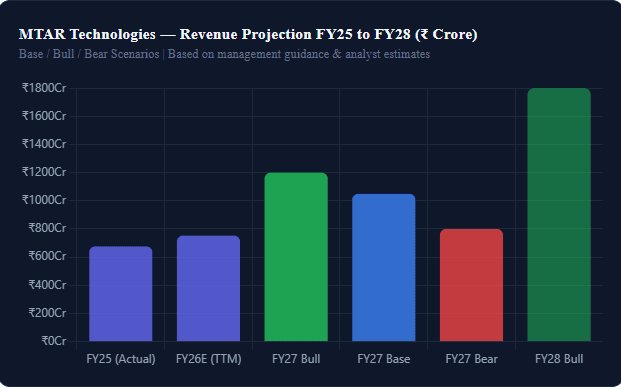
At TTM revenue of ₹753 crore, a 50% growth in FY27 means revenue of approximately ₹1,130 crore. At a 20% OPM (conservative), that generates ₹226 crore in operating profit. After interest and depreciation, net profit could approach ₹130–₹150 crore — more than double current levels. That would put the forward PE (on FY27 earnings) at approximately 100–115x. Still expensive, but much more digestible than 224x.
April 2026 Order Win: Data Centre Energy
MTAR secured a USD 3.78 million (₹35.56 crore) international order for data centre energy products in April 2026, with deliveries scheduled until December 2026. This signals MTAR’s entry into the data centre power infrastructure space — a new growth avenue beyond its existing four sectors. For tracking upcoming corporate announcements from MTAR, the BSE announcements page for MTAR Technologies. For detailed financials, Screener.in MTAR Technologies page is the most comprehensive free resource available.
Bloom Energy Oracle Deal: The Catalyst That Moved MTAR Technologies Share Price
If one single event explains the 2025 explosion in MTAR Technologies share price, it is Bloom Energy’s landmark 2.8 GW fuel cell deal with Oracle.
What Is the Deal?
Bloom Energy signed a deal to supply fuel cells providing 2.8 gigawatts of power to Oracle’s AI data centres. This is one of the largest single clean energy contracts ever signed. Bloom Energy fuel cells require hot box assemblies — and MTAR is Bloom Energy’s primary supplier of hot box components. A 2.8 GW contract for Bloom Energy translates directly into a multi-year order pipeline for MTAR Technologies.
How Big Is This for MTAR?
A 1 GW fuel cell deployment roughly requires approximately ₹2,000–₹3,000 crore worth of hot box components. The full 2.8 GW deal could represent ₹5,600–₹8,400 crore of hot box orders over the contract period — spread across 3–5 years. Even if MTAR captures 30%–40% of the total component value, the revenue addition is transformational relative to its current ₹753 crore TTM revenue base.
Dependency Risk
Bloom Energy is MTAR’s largest single client. If Bloom Energy faces execution delays, financing issues, or if the Oracle deal gets deferred, MTAR’s revenue projection changes materially. This concentration risk is real and is one reason the stock carries such extreme valuation multiples — both as a premium for growth optionality and as a risk discount for client dependency.
The MTAR Technologies share price surged 10% to a 52-week high of ₹6,969 on 13 May 2026, the day after its Q4 FY26 results came in far above expectations. By 22 May, the stock extended gains to ₹8,299, lifted further by a ₹2,279 crore order win announcement.
Here is what the quarterly numbers looked like:
| Metric | Q4 FY26 | Q4 FY25 | YoY Change |
|---|
| Revenue (₹ crore) | 306.1 | 183.0 | +67.2% |
| EBITDA (₹ crore) | 61.8 | 34.1 | +80.9% |
| EBITDA Margin | 20.2% | 18.7% | +150 bps |
| PAT (₹ crore) | 44.3 | 13.7 | +222.3% |
| EPS (₹) | 14.4 | 4.5 | +222% |
For the full year FY26, revenue grew 29.6% to ₹876.2 crore. EBITDA rose 41.7% to ₹171.2 crore. Profit before tax surged 75% to ₹126.1 crore and PAT jumped 76.2% to ₹94 crore. The gross margin for FY26 was 47.7%. Operating cash flow improved sharply to ₹196.9 crore from ₹101.3 crore the prior year, addressing the working capital concerns that had weighed on the stock through most of 2025.
The managing director, Parvat Srinivas Reddy, described FY26 as “a phenomenal year marked by robust revenue growth and the highest ever inflow of orders.” The closing order book for FY26 was ₹2,580 crore, marginally short of the ₹2,800 crore guidance, but management explained that certain nuclear and defence orders slipped to Q1 FY27 without any change in business trajectory.
Revenue breakdown by segment
MTAR’s revenues come from four broad areas. Understanding this mix is useful when tracking the MTAR Technologies share price because the stock moves with order wins in specific segments.
| Segment | FY26 Revenue (₹ crore) | Share of Total |
|---|
| Clean energy (fuel cells / Bloom Energy) | 615.4 | ~70% |
| Aerospace & defence | 103.8 | ~12% |
| Products & others | ~131 | ~15% |
| Nuclear & space | ~26 | ~3% |
Exports account for 82% of FY26 revenue, which makes the stock sensitive to global energy demand and foreign exchange movements. The clean energy segment — mainly hot box assemblies for Bloom Energy’s solid oxide fuel cells — is the dominant driver. But the nuclear and defence segments, though smaller today, carry the highest potential for step-change revenue in FY27 and beyond.
Nuclear: the long-term wildcard
MTAR supplied 70% of the materials for India’s Fast Breeder Reactor (FBR) core. The company has completed 70% of the prototype core after 10–15 years of R&D. Once India’s thorium-based Stage 3 reactors begin ordering components, each reactor order could bring MTAR roughly ₹1,500 crore in revenue. This is a multi-year, high-visibility revenue stream that most investors undermodel today.
Defence and aerospace pick-up
Defence revenue grew to ₹103.8 crore in FY26 from a lower base, contributing about 12% of revenues. As India’s domestic defence manufacturing push continues under the government’s Make in India policy, MTAR’s long-standing relationships with DRDO and ISRO give it access to complex, sticky orders. If you want to track defence sector momentum, checking the stock return calculator for peer comparison can help put MTAR’s performance in context.
The Bloom Energy connection — and why it matters so much
Around 70% of MTAR’s revenues come from a single customer: Bloom Energy Corporation (NYSE: BE), a US-based clean energy company. MTAR makes the hot box assemblies at the heart of Bloom’s solid oxide fuel cell systems. This high concentration means that whatever happens at Bloom directly flows through to the MTAR Technologies share price.
In Q1 2026, Bloom Energy reported revenue of $751.1 million — a 130% jump year-on-year — driven by hyperscaler data centre orders. Bloom raised its full-year 2026 guidance to $3.4–3.8 billion in revenue, representing roughly 80% growth. To meet this demand, Bloom needs far more hot box assemblies, which means substantially more orders for MTAR. In April 2026, MTAR received a purchase order worth USD 48.68 million (approximately ₹467 crore) from an international customer. The company also won a separate ₹35.6 crore international data centre order in April.
The Bloom Energy–Oracle deal that CNBC TV18 reported in May 2026 — under which Bloom supplies 2.8 GW of fuel cells — is particularly consequential. If even a portion of the components for that deal flow through MTAR, the revenue impact will be material in FY27 and FY28. Management has guided for 50% revenue growth in FY27, supported by an order book expected to grow from ₹2,580 crore to around ₹5,000 crore by end of FY27.
The flip side: heavy dependence on one customer is a real risk. Any slowdown in Bloom’s business, supply chain issue, or change in their sourcing strategy would hit MTAR’s revenues hard. This concentration risk is one reason the P/E multiple on MTAR requires careful handling — investors are essentially underwriting both MTAR and Bloom’s growth in one trade.
Key financial metrics at a glance
Before putting money into any stock, it helps to see the full financial picture. Below is a multi-year snapshot of the numbers behind the MTAR Technologies share price movement.
Annual profit and loss summary
| Year | Revenue (₹ cr) | EBITDA (₹ cr) | OPM % | Net Profit (₹ cr) | EPS (₹) |
|---|
| FY21 | 246 | 83 | 34% | 46 | 14.98 |
| FY22 | 322 | 94 | 29% | 61 | 19.79 |
| FY23 | 573 | 154 | 27% | 104 | 33.84 |
| FY24 | 580 | 112 | 19% | 56 | 18.29 |
| FY25 | 676 | 121 | 18% | 54 | 17.51 |
| FY26 | 876 | 171 | 19.5% | 94 | ~30.5 |
The table tells an interesting story. FY23 was a breakout year on both revenue and margins. FY24 saw margins compress as input costs rose and working capital lengthened. FY25 was a trough in profitability despite revenue growing. FY26 shows a genuine recovery — revenue accelerated, margins expanded, and net profit essentially doubled from FY25. This recovery profile is what sent the share price into triple-digit gains.
Compounded growth rates
- 10-year compounded sales growth: 24%
- 5-year compounded sales growth: 26%
- 3-year compounded sales growth: 28%
- 1-year stock price CAGR: 260%
If you are using a CAGR calculator, plugging in MTAR’s revenue numbers over different periods quickly shows how consistent the sales growth has been — even during quarters when profits were under pressure.
Return ratios
| Metric | FY26 | 3-Year Avg |
|---|
| ROE | ~11.5% (est.) | 11% |
| ROCE | ~12% (est.) | 11% |
| Debt-to-Equity | 0.25 | ~0.3 |
| Operating Cash Flow (₹ cr) | 196.9 | ~86 |
Return ratios are modest relative to the current P/E of ~213x. The market is not pricing MTAR on today’s earnings but on what FY27 and FY28 could look like if the order book converts as guided. Motilal Oswal’s target price of ₹8,000 is based on 60x FY28 estimated EPS — which implies roughly 67–86% CAGR in revenue and EBITDA over FY26–FY28.
Shareholding pattern (March 2026)
One number that deserves attention in any shareholding analysis is the promoter stake trend. Promoter holding has declined from 50.25% at the time of the IPO in FY21 to 30.44% as of March 2026. That is a significant reduction — 20 percentage points over five years. In May 2026, co-promoter Akepati Pranay Reddy sold an additional 60,000 shares in the open market, bringing his holding to 0.61% of the company.
Promoter stake reduction is not always a red flag — early-stage investors sometimes sell to fund personal diversification, and the stock has risen multifold since IPO. But it is worth monitoring. On the positive side, FII holding has jumped sharply from 6.74% in March 2025 to 17.31% in March 2026, indicating growing overseas institutional interest.
| Category | Mar 2025 | Mar 2026 |
|---|
| Promoters | 31.77% | 30.44% |
| FIIs | 6.74% | 17.31% |
| DIIs (Mutual Funds etc.) | 24.40% | 27.66% |
| Public / Retail | 37.10% | 24.59% |
The shift from retail to institutional ownership is quite visible. Public/retail holding dropped from 37% to under 25%, while FII + DII combined now hold over 45%. This institutional accumulation tends to reduce extreme volatility over time, though it does not eliminate it. The number of shareholders fell from 3.01 lakh in March 2025 to 2.09 lakh in March 2026, consistent with smaller investors booking profits during the rally.
Pros and cons for investors considering MTAR Technologies
No investment decision should rest on a single factor. Here is a balanced view of MTAR Technologies as a stock, keeping in mind where the share price stands today.
Reasons to be positive
- Order book growing from ₹2,580 crore to a guided ₹5,000 crore by FY27 end — strong revenue visibility.
- Bloom Energy’s hyperscaler demand surge (80% revenue guidance for 2026) directly benefits MTAR’s top line.
- Nuclear and defence segments offer long-duration, high-value contracts with government backing.
- Ten-year compounded sales growth of 24% — not a one-year story.
- Working capital improved materially in FY26; operating cash flow nearly doubled to ₹196.9 crore.
- India’s defence indigenisation push under SEBI-listed defence PSUs creates a long tailwind.
- FII buying surge — global funds are increasing exposure to India’s precision defence supply chain.
Reasons to be cautious
- P/E of ~213x — priced to near-perfection; any earnings miss could cause sharp corrections.
- Over 70% revenue from a single customer (Bloom Energy) — concentration risk is real.
- Promoter stake has fallen from 50% to 30% since IPO — worth watching for further dilution.
- Stock rose 500% from 52-week low in nine months — near-term valuations may limit upside.
- No dividend paid since FY22 — not a yield play.
- Long cash conversion cycle (370+ days) despite improvement; capital-intensive business.
Analyst targets and share price outlook for FY27
Motilal Oswal has a BUY rating on MTAR Technologies with a target price of ₹8,000 per share. The target is based on 60x FY28 estimated EPS and implies a roughly 0.6x PEG ratio on the FY26–FY28 earnings CAGR. As of 25 May 2026, the stock is trading at ₹4,941, which is 38% below that target — suggesting the recent pullback from ₹8,299 has opened an entry window for those comfortable with the valuation risk.
The brokerage firm estimates 67% / 86% / 105% CAGR in revenue / EBITDA / adjusted PAT over FY26–FY28. These projections rest on three things actually happening: Bloom Energy orders continuing to grow, MTAR converting its nuclear pipeline, and the defence order ramp picking up. All three look plausible based on current order book data, but execution risk is non-trivial in a capital-intensive, long-lead-time business.
Peer comparison (Aerospace and Defence sector)
| Company | Market Cap (₹ cr) | P/E (TTM) | P/B |
|---|
| MTAR Technologies | ~15,189 | ~213x | ~20x |
| LMW | 14,414 | 125x | 5.09x |
| Azad Engineering | 11,243 | 92x | 7.6x |
| Tega Industries | 12,713 | 63x | 3.99x |
| Usha Martin | 13,265 | 32x | 4.47x |
MTAR trades at a significant premium to peers on both P/E and P/B. The premium is partially justified by its unique positioning in nuclear and clean energy — segments where almost no domestic competitor exists. But premium valuations require premium execution, and the coming quarters will be closely watched by institutional investors. Use the P/E ratio calculator to cross-check how MTAR’s current multiple stacks up against its own historical range and sector peers.
Risks to watch before investing
Long-term investors in MTAR Technologies should keep these specific risks on their radar, beyond the general market volatility that affects all stocks:
Customer concentration
The relationship with Bloom Energy is both MTAR’s biggest strength and its biggest vulnerability. Bloom’s 2026 guidance of $3.4–3.8 billion in revenue looks solid today, but fuel cell technology faces competition from alternative clean energy sources. Any reversal in Bloom’s data centre demand — whether from technology shifts, financing difficulties, or geopolitical changes in the US energy market — would hit MTAR hard.
Valuation risk
A P/E of 213x prices in years of strong growth. If MTAR misses even one major quarter, the stock could correct sharply. The 16% single-day drop after weak Q4 FY24 results is a clear precedent. Investors used to calculating stock average prices after corrections should be prepared for that kind of volatility.
Working capital and cash cycle
Despite the FY26 improvement, MTAR’s cash conversion cycle remains long at around 370 days. The company has significant inventory (₹500 crore in March 2026) and receivables (₹336 crore), tied up in long-duration contracts. This structure means MTAR needs continued access to working capital financing. Current borrowings of ₹177–186 crore are manageable, and shareholders recently approved borrowing limits up to ₹800 crore, giving the company headroom for FY27 growth.
Promoter stake decline
The drop from 50% to 30% promoter holding warrants monitoring. Open market share sales by promoters (most recently in May 2026) can signal changing confidence or create near-term selling pressure.
How to invest in MTAR Technologies
MTAR Technologies trades on both NSE (MTARTECH) and BSE (543270). You can buy it through any SEBI-registered broker. If you are new to direct equity investing, the first step is opening a demat and trading account.
Before buying, it is worth doing a few calculations to understand your risk exposure:
- Use the position size calculator to decide how much of your portfolio to allocate — at 213x P/E, a smaller position size than usual makes sense.
- Set a clear stop-loss level before buying. MTAR has shown it can drop 15–20% in a single session on bad news.
- The brokerage calculator can help you estimate the total transaction cost before placing your order.
- If you are building a position through regular buying, the stock average calculator helps track your average entry price across multiple purchases.
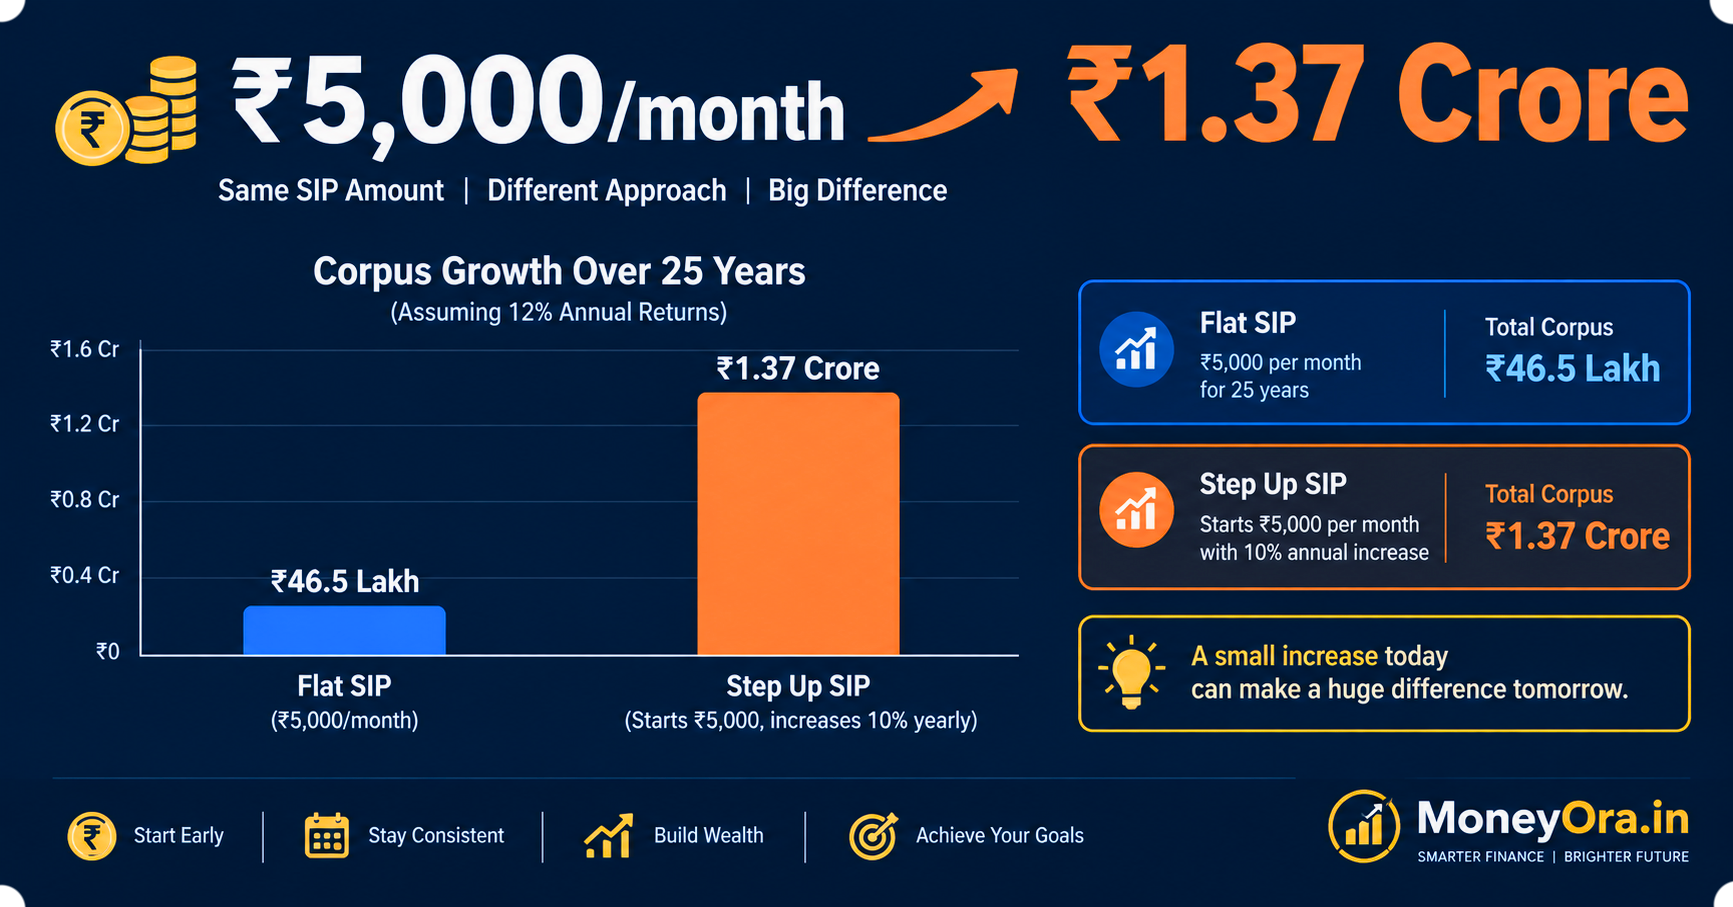
For long-term investors who believe in the nuclear and defence story, systematic investing — adding during dips rather than chasing the price — tends to work better for high-P/E growth stocks. A SIP calculator can help model what regular monthly investments could look like over time, even in direct equity (where you replicate the SIP discipline manually).
If you prefer indirect exposure through a fund, four mutual funds hold MTAR in their portfolios: Sundaram Small Cap Fund, HSBC Infrastructure Fund, HSBC Small Cap Fund, and Franklin India Small Cap Fund. Comparing returns on these funds using a lumpsum calculator or SWP calculator can help you figure out which option suits your goals. For tax-efficient long-term saving, it is worth comparing the returns against PPF or NPS to balance risk across your overall portfolio.
You can read more about how MTAR fits into the broader market by checking resources from NSE India’s equity data page for MTARTECH and the Wikipedia overview of MTAR Technologies for historical background on the company.
Bull Case vs Bear Case for MTAR Technologies Share Price
Bull Case — Why MTAR Technologies Share Price Could Go Higher- Bloom Energy Oracle Deal: 2.8 GW = multi-year hot box orders potentially worth ₹5,000–₹8,000 crore over 3–5 years
- FBR nuclear orders: Each Stage 3 reactor order = ₹1,500 crore revenue; India plans 6+ thorium reactors
- 50% FY27 revenue guidance: Management-confirmed target, backed by strong order visibility
- FII buying: Foreign institutions have raised stake from 3% to 17% — sophisticated money is buying
- Defence supercycle: India’s defence budget growing; import substitution push benefits MTAR directly
- Data centre entry: New revenue stream from international data centre energy orders
- FCF positive: Capex cycle complete; free cash flow now positive, improving balance sheet quality
Bear Case — Risks to MTAR Technologies Share Price- Bloom Energy concentration: 70%+ of exports from a single client; any delay in Oracle deal execution hurts immediately
- PE of 224x: Already pricing in perfection; any earnings miss triggers sharp correction
- Promoter selling: Holding fallen from 50% to 30% in 5 years — alignment risk
- Nuclear timeline uncertainty: FBR Stage 3 orders depend on government programme which has faced delays for 15+ years
- Margin volatility: OPM swings between 13% and 28% quarter to quarter — earnings very lumpy
- ROE below 10%: Capital efficiency still poor despite large asset base
- High cash conversion cycle: 370 days cash conversion cycle means large working capital tied up
MTAR Technologies Share Price Target: FY26, FY27, FY28

Scenario-Based Share Price Target for MTAR Technologies
MTAR Technologies Share Price Target — FY27 Scenarios| Scenario | FY27 Revenue | Net Profit Est. | EPS Est. | PE Applied | Target Price |
|---|
| Bull Case | ₹1,200 Cr | ₹160 Cr | ₹52 | 100x | ₹5,200 |
| Base Case | ₹1,050 Cr | ₹120 Cr | ₹39 | 80x | ₹3,120 |
| Bear Case | ₹800 Cr | ₹70 Cr | ₹23 | 60x | ₹1,380 |
*These are scenario-based estimates for educational purposes only. Not investment advice. MTAR Technologies share price targets depend on Bloom Energy order execution, nuclear programme timeline, and market PE re-rating.
What the Current Price Is Implying
At ₹4,941, the market is essentially pricing the bull case with some room to spare. The stock is not cheap on any traditional metric. It is a pure growth-and-optionality play on India’s defence, nuclear, and global clean energy buildout. Investors buying at current levels are betting that the 50% revenue growth happens, margins recover, and the Bloom Energy-Oracle deal executes on time.
Investment Horizon Matters
Short-term (0–12 months): High volatility; any delay in order execution could reset the price significantly. Long-term (3–5 years): If even two of the three major catalysts (Bloom Energy, nuclear, defence) deliver, MTAR’s revenue by FY29 could be ₹2,000+ crore with PAT of ₹300–₹400 crore. At 50–60x PE on that earnings level, the market cap would be ₹15,000–₹24,000 crore — roughly where it is today. The upside in the long case is actually not as dramatic as the recent price move suggests.
Related Financial Calculators on MoneyOra
Stock Analysis Tools
Investment Planning Tools
- SIP Calculator — Model monthly SIP in a defence/smallcap fund vs direct MTAR investment
- Lumpsum Calculator — Project lumpsum MTAR investment at different CAGR scenarios
- FD Calculator — Compare guaranteed FD returns with MTAR’s risk-adjusted return
- PPF Calculator — Balance equity risk with tax-free PPF allocation
- NPS Calculator — Retirement corpus alongside equity portfolio
- EPF Calculator — Provident fund balance vs equity investment planning
- SWP Calculator — Systematic withdrawal from equity portfolio post-target
- RD Calculator — Recurring deposit as safe allocation alongside MTAR risk
Banking Tools






Pingback: Netweb Technologies Share Price Target 2026: Next AI Multibagger Stock? - MoneyOra
Pingback: AI Stock Picks 2026: Next 5 Multibagger AI Stocks You Should Know - MoneyOra
Pingback: Share Market Today: Will Nifty & Sensex Continue Their Bull Run This Week 26? - MoneyOra
Pingback: Should You Invest in the Defence Index India in 2026? Top Stocks, Returns & Future - MoneyOra
Pingback: Gold Reserve in India Hits 880 Tonnes: Why Is RBI Bringing Gold Back Home - MoneyOra