
Stop Loss
Calculator
Optimal trade size for Stocks, F&O & Crypto — based on your capital and stop-loss.
Shares = (Capital × Risk%) ÷ (Buy − SL)Invest = Shares × Buy PriceMax Loss = Shares × (Buy − SL)| Risk % | Shares | Investment | Max Loss | % of Capital |
|---|
Stop Loss Calculator: 7 Best Ways to Cut Trading Losses Fast
Every trader who has blown a trading account will tell you the same thing: they didn’t use a stop loss. A stop loss calculator is one of the simplest tools in trading — yet most beginners skip it entirely. That one mistake can wipe out weeks of profit in a single bad trade. “set stop loss before buying high-PE semiconductor stocks”
Whether you trade stocks on NSE, forex pairs like XAUUSD, Bitcoin, or mutual funds, knowing exactly where to exit a losing trade is what separates disciplined traders from gamblers. This guide covers how to use a stop loss calculator for every major market — stocks, forex, crypto, options, futures, and gold — with real examples you can apply immediately. “factor in brokerage charges when setting stop loss levels”
Use MoneyOra’s free stop loss calculator to set your exact exit levels before you enter any trade.
What is a stop loss and why does it matter?
A stop loss is a pre-set price at which you exit a trade if it moves against you. Think of it as an emergency exit. You decide before entering a trade that “if this stock falls to ₹480, I am out — no questions asked.”
Without this rule, most traders do the opposite: they watch losses grow, hope the market turns around, and end up holding a trade that should have been closed hours or days ago. This is called loss aversion bias — and it destroys more trading accounts than any market crash.
The Reserve Bank of India and SEBI both encourage retail investors to use risk management tools when trading equity derivatives and currency futures. A stop loss is the most basic risk management tool available.
Here’s what a stop loss actually does for you:
- Limits your maximum loss per trade to an amount you chose
- Removes emotional decision-making from losing positions
- Lets you stay in the market longer by protecting capital
- Makes position sizing (how much to buy or sell) more precise
Interestingly, a stop loss calculator also connects to position sizing. If you know your stop loss level, you can figure out exactly how many shares or lots to buy without risking more than 1–2% of your account. MoneyOra’s position size calculator handles this calculation automatically.
How a stop loss calculator works
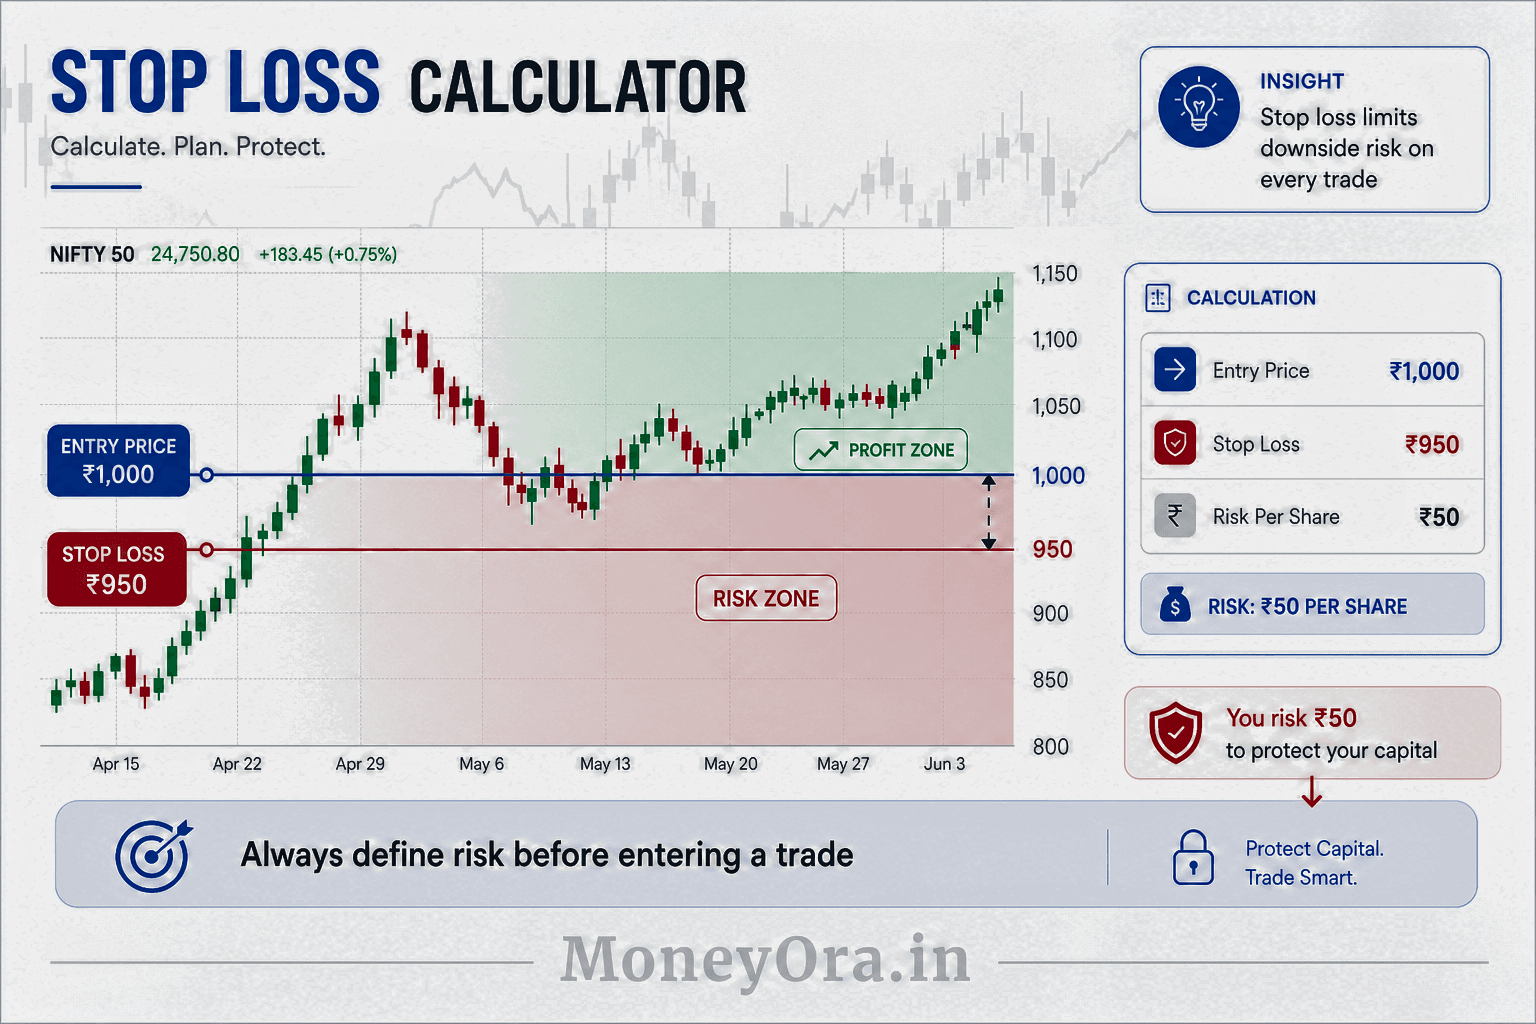
A stop loss calculator takes three inputs and gives you one clear output: the exact price at which to exit your trade.
The three inputs are:
- Entry price — the price at which you bought (or shorted) an asset
- Risk amount or percentage — how much of your capital you’re willing to lose on this trade
- Position size — how many shares, lots, or units you’re trading
From these, the calculator tells you:
- Your stop loss price
- The distance from entry to stop loss (in rupees, pips, or percentage)
- Your total risk in money terms (e.g., ₹500 loss if stopped out)
For example: You buy Reliance at ₹2,800. You’re willing to lose ₹1,400 on this trade (1% of a ₹1,40,000 account). You’re buying 100 shares. The calculator tells you: set your stop loss at ₹2,786. If Reliance falls to ₹2,786, you exit and your total loss is exactly ₹1,400.
Simple. Mechanical. No emotions involved.
You can try this right now with MoneyOra’s stop loss calculator — it’s free and works for stocks, forex, crypto, and commodities.
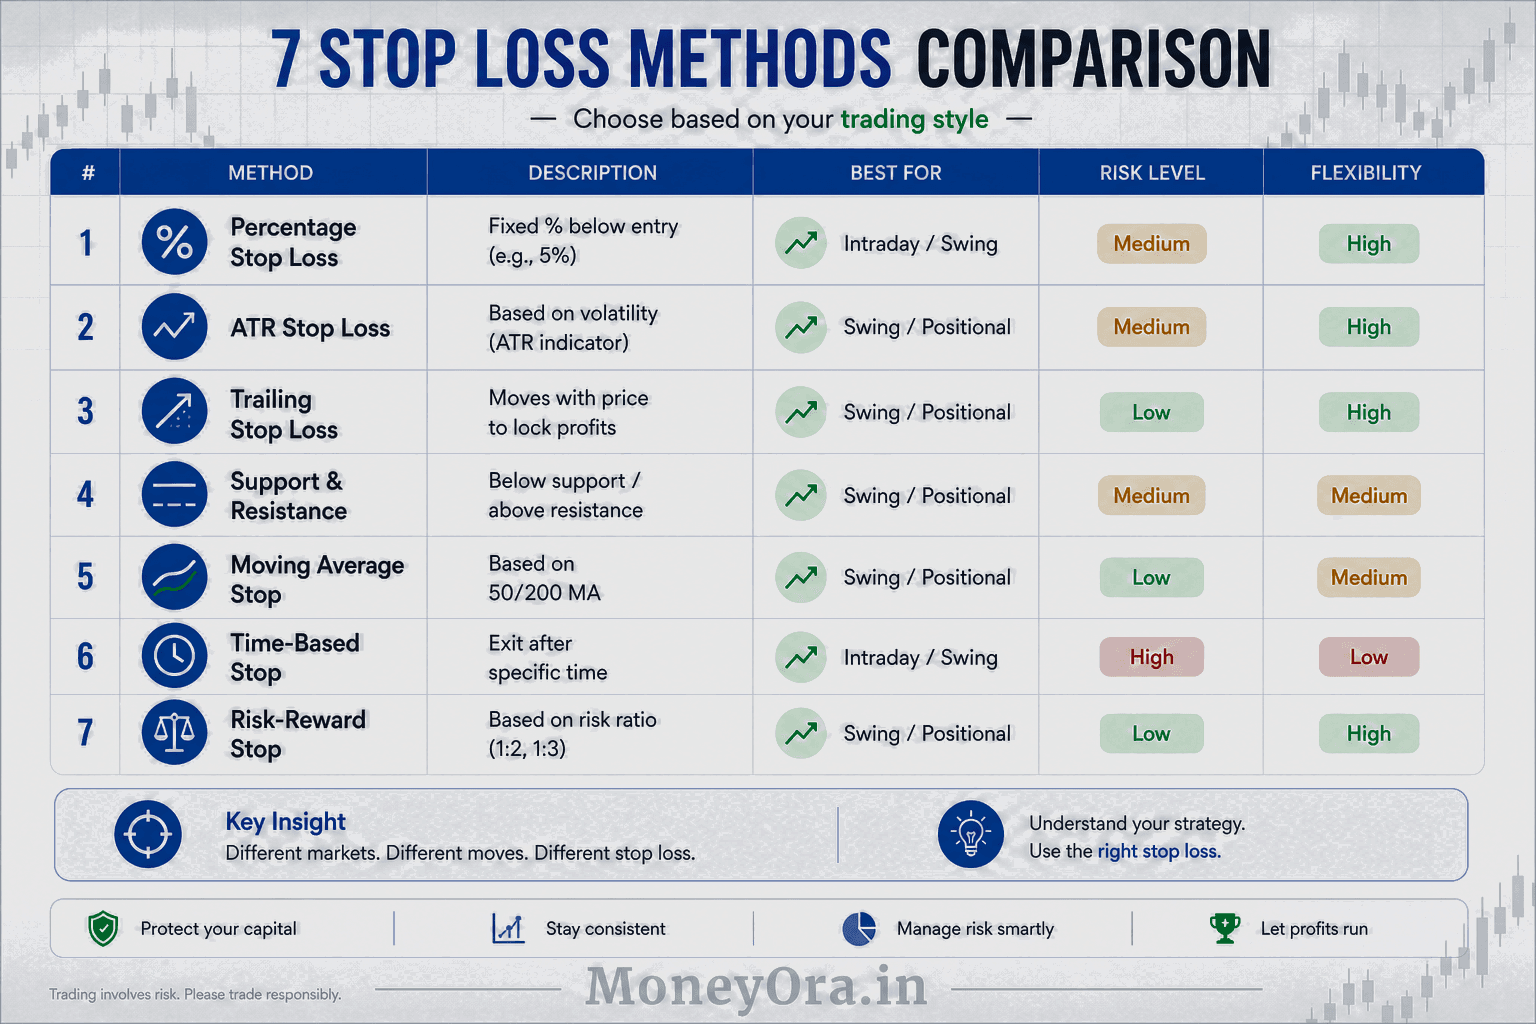
7 best stop loss methods (with formulas)
There is no single “correct” way to place a stop loss. The best method depends on your market, timeframe, and trading style. Here are the 7 most reliable methods used by traders worldwide.
1. Percentage-based stop loss
The simplest method. You risk a fixed percentage of the entry price.
Formula: Stop Loss = Entry Price × (1 − Risk%)
Example: Entry at ₹500, risk 2% → Stop Loss = ₹500 × 0.98 = ₹490
Works well for beginners. Consistent and easy to calculate.
2. ATR-based stop loss
ATR (Average True Range) measures how much an asset moves on average. An ATR stop loss respects that volatility rather than using an arbitrary percentage.
Formula: Stop Loss = Entry Price − (ATR × Multiplier)
Example: Entry at ₹500, ATR = ₹8, multiplier = 2 → Stop Loss = ₹500 − ₹16 = ₹484
This is what professional traders use. It avoids getting stopped out by normal market noise.
3. Support and resistance stop loss
You place the stop just below a strong support level. If price breaks support, the trade is invalid.
Example: A stock has clear support at ₹480. You buy at ₹495. Stop loss goes just below support at ₹478.
4. Moving average stop loss
You exit the trade if price closes below a key moving average — typically the 20-day, 50-day, or 200-day MA.
Popular among swing traders who hold positions for days or weeks.
5. Trailing stop loss
The stop loss moves upward as the price rises, locking in profits automatically. If price reverses by the trail amount, you exit.
Example: You buy at ₹500 with a 3% trailing stop. Stop starts at ₹485. When price hits ₹600, stop moves to ₹582. Price falls to ₹582 — you exit with profit.
6. Fixed rupee/dollar stop loss
You decide upfront: “I will lose no more than ₹2,000 on this trade.” Then calculate backwards to find the stop loss price.
Formula: Stop Loss = Entry Price − (Risk Amount ÷ Number of Shares)
7. Candlestick-based stop loss
You place the stop just below the low of a specific candle — usually the signal candle that triggered your entry. Common in price action trading.
Each of these methods is supported by MoneyOra’s stop loss calculator. You can also use the margin calculator alongside it to check how much margin you need for your position.
Stop loss calculator for stocks (India)
Indian equity traders on NSE and BSE have two types of stop loss orders: SL (Stop Loss Limit) and SL-M (Stop Loss Market). Understanding the difference matters before you place any order.
SL order: You set a trigger price and a limit price. When trigger is hit, a limit order fires at your set price. You may not get filled if market moves fast.
SL-M order: When trigger is hit, a market order fires. You get filled at the best available price — but in a fast-moving market, this could be worse than your trigger.
For the stop loss calculator India use case, here’s a worked example for intraday trading:
- Stock: HDFC Bank
- Entry price: ₹1,650
- Account size: ₹1,00,000
- Risk per trade: 1% = ₹1,000
- Number of shares to buy: ?
First, decide your stop loss distance. Using ATR (say ATR = ₹15, multiplier 1.5): Stop loss distance = ₹22.5. So stop loss price = ₹1,650 − ₹22.5 = ₹1,627.5.
Now calculate shares: ₹1,000 ÷ ₹22.5 = 44 shares.
So you buy 44 shares of HDFC Bank at ₹1,650 and place a stop loss at ₹1,627.5. If stopped out, you lose exactly ₹990 — within your 1% limit.
For the complete calculation, use the stock return calculator to also estimate the potential upside on the trade before entering. And if you’re averaging into a position, the stock average calculator shows you how your average entry price changes.
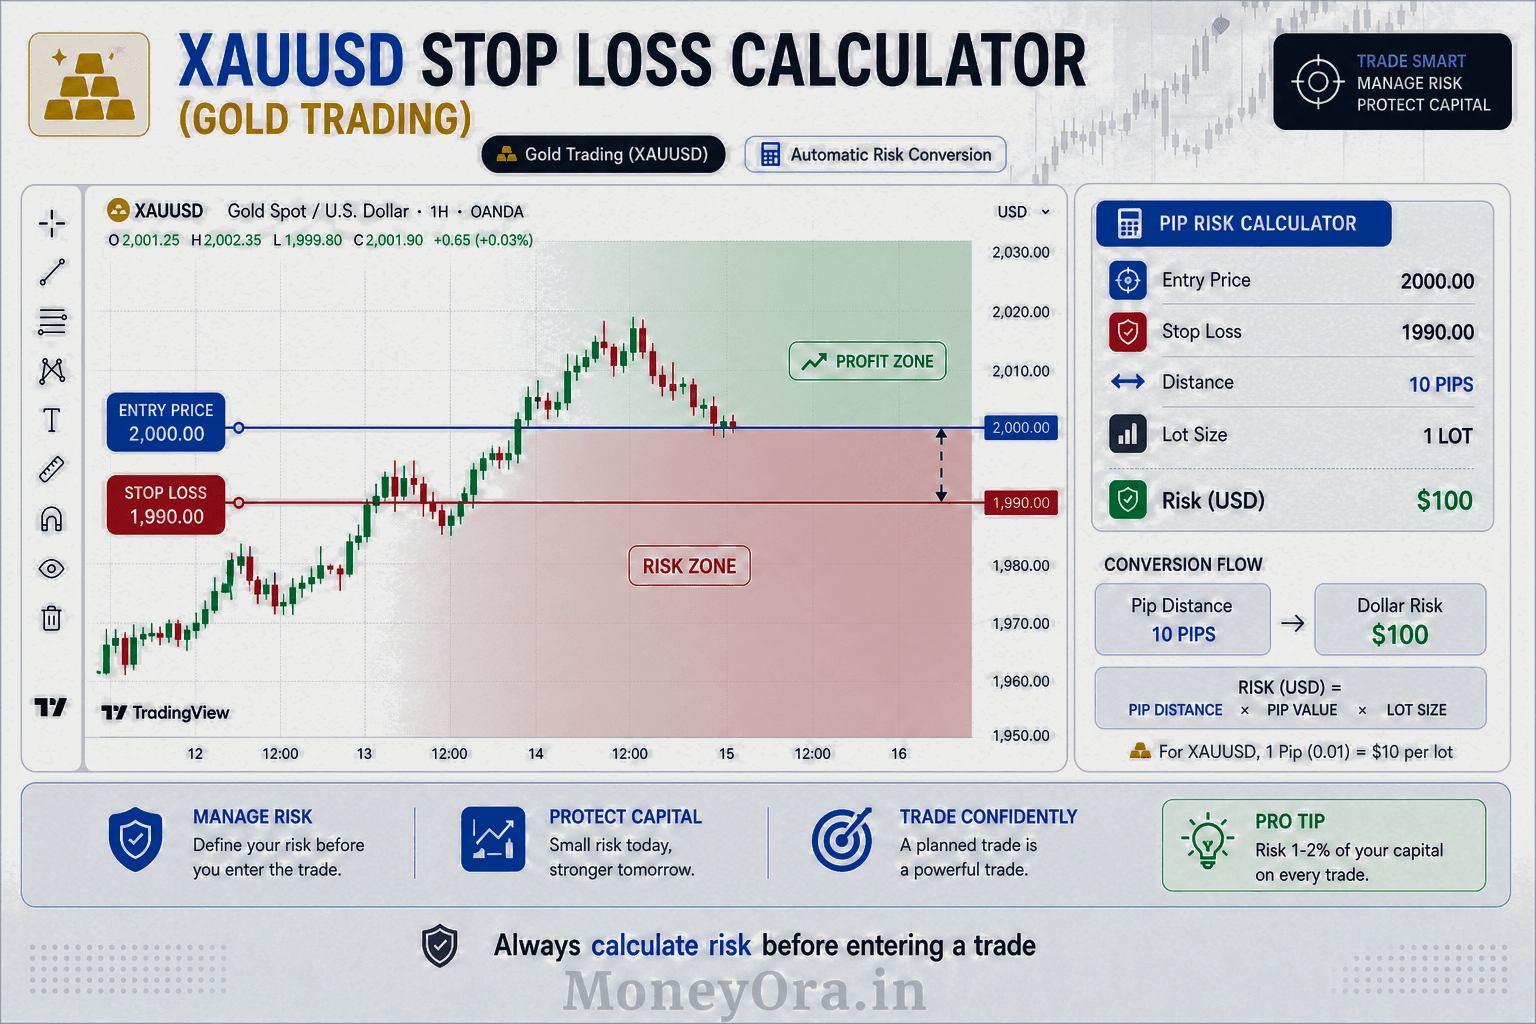
Stop loss calculator for forex and XAUUSD gold
Forex trading uses pips as the unit of price movement. A stop loss calculator for forex converts your pip distance into actual money so you know your exact dollar or rupee risk.
The XAUUSD stop loss calculator (gold vs US dollar) is particularly popular among Indian traders who trade gold on MT4 or MT5 platforms through brokers registered with SEBI or offshore platforms.
How pip-based stop loss works
For EURUSD (quoted to 4 decimal places): 1 pip = 0.0001. For XAUUSD (gold): 1 pip = $0.01.
Example for XAUUSD (gold stop loss calculator):
- Entry: $2,350
- Stop Loss: $2,335 (15 pips away)
- Lot size: 0.1 standard lot
- Pip value for gold (0.1 lot): $1 per pip
- Total risk: 15 pips × $1 = $15
In rupees (at ₹83/USD): ₹15 × 83 = ₹1,245 risk per trade.
The gold stop loss calculator on MoneyOra does this conversion automatically. You enter entry price, stop loss price, lot size, and your account currency — and it shows your exact risk in INR or USD.
For a deeper understanding of how gold returns work over time, the CAGR calculator on MoneyOra can show you gold’s compounded returns over any period.
Stop loss calculator for crypto (BTC and altcoins)
Crypto markets are notoriously volatile. Bitcoin (BTC) can move 5–10% in a single hour. This makes stop loss placement both more important and more tricky than in stock markets.
The BTC stop loss calculator follows the same logic as stocks, but you need to account for wider price swings. Most experienced crypto traders use an ATR-based stop rather than a fixed percentage — because a 1% stop on Bitcoin will get triggered almost every single day.
Crypto stop loss example (BTC)
- Entry: $65,000
- Account size: $5,000
- Risk per trade: 2% = $100
- ATR (daily): $2,500
- Multiplier: 1.5
- Stop distance: $2,500 × 1.5 = $3,750
- Stop loss price: $65,000 − $3,750 = $61,250
- Position size: $100 ÷ $3,750 = 0.0267 BTC
With this setup, if Bitcoin falls to $61,250, you lose exactly $100 — which is your planned 2% risk. This is the kind of mechanical precision that keeps crypto traders in the game during volatile periods.
For altcoins, the same logic applies but with even wider ATRs. Always check recent daily price ranges before setting a stop.
According to Wikipedia’s article on stop-loss orders, stop loss orders in volatile markets can suffer from slippage — meaning you may get filled slightly worse than your set price. This is why using a stop-limit order (rather than stop-market) is often better in crypto.
Stop loss for options and futures
Options and futures require a slightly different approach to stop loss. Because options have time decay (theta) eating into their value even when the underlying stays flat, a simple price-based stop loss can be misleading.
Stop loss calculator for options
For options buyers, the standard approach is a premium-based stop loss:
Rule of thumb: Exit if the option premium falls 30–50% from your entry.
Example: You buy a Nifty CE option at ₹120 premium. Stop loss = ₹120 × 0.50 = ₹60. If premium drops to ₹60, you exit.
For options sellers, the stop loss is typically set at the underlying asset’s price, not the premium. If you sold a put at Nifty 22,000 and the underlying falls to 21,800, that’s your trigger — even if the premium hasn’t doubled yet.
Check MoneyOra’s option price calculator to see how changes in underlying price affect your option’s value before placing a trade.
Stop loss calculator for futures
Futures trading uses lot sizes. The futures stop loss calculator needs: entry price, stop loss price, and lot size. It then calculates total rupee risk per lot.
Example — Nifty Futures:
- Entry: 22,500
- Stop Loss: 22,350 (150 points)
- Lot size: 50
- Risk per lot: 150 × 50 = ₹7,500
Use MoneyOra’s brokerage calculator alongside this to factor in trading costs, because brokerage and taxes eat into your risk-reward ratio on every futures trade.
Trailing stop loss — when and how to use it
A trailing stop loss moves in your favour as the trade profits. It doesn’t move backwards. So if you set a 3% trailing stop and the stock goes from ₹500 to ₹600, your stop trails up to ₹582 (3% below ₹600).
The trailing stop loss calculator needs one extra input compared to fixed stop loss: the trail distance, either as a percentage or a fixed rupee amount.
When to use trailing stop loss
- In strong trending markets where you want to ride the trend without a fixed exit
- When you’re in a profitable trade and want to protect gains while staying in
- For swing trades where you don’t want to monitor the screen constantly
When NOT to use trailing stop loss
- In choppy, sideways markets — you’ll get stopped out repeatedly by normal price noise
- Near earnings announcements where price gaps are common
- In illiquid stocks where spreads are wide
One practical tip: don’t set a trailing stop too tight. A 0.5% trailing stop on a stock that moves 1–2% daily will get hit almost every day. Use ATR to calculate a realistic trail distance.
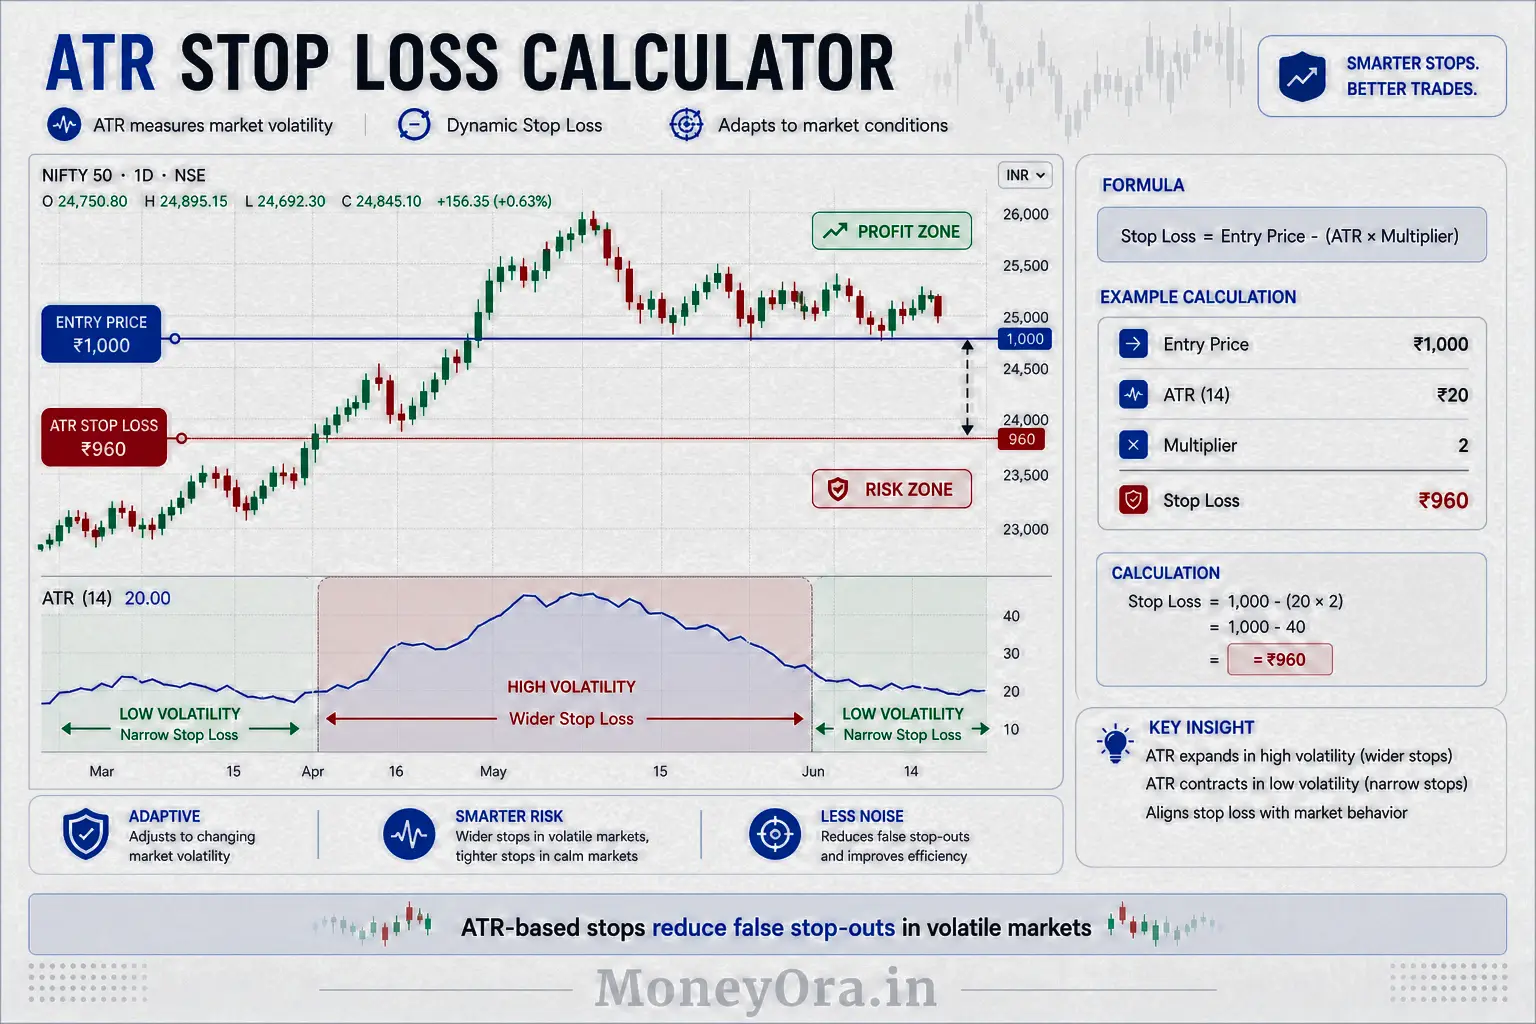
ATR stop loss calculator explained
The Average True Range (ATR) was developed by J. Welles Wilder and is one of the most respected volatility indicators in technical analysis. An ATR stop loss calculator uses this volatility to set stops that breathe with the market rather than fighting it.
How to use ATR for stop loss
Step 1: Find the ATR value for your asset on your chosen timeframe (daily, hourly, etc.). Most trading platforms show this directly.
Step 2: Multiply ATR by a factor. Common factors are 1.5x for tight stops and 2x–3x for wider stops.
Step 3: Subtract from entry price (for long trades).
Formula: Stop Loss = Entry Price − (ATR × Factor)
Example for a Nifty 50 stock with daily ATR of ₹20:
- Entry: ₹850
- ATR: ₹20
- Factor: 2
- Stop Loss: ₹850 − ₹40 = ₹810
This stop at ₹810 is 4.7% below entry — wider than a fixed 2% stop, but it accounts for the stock’s actual daily movement. It won’t get triggered by a normal pullback.
How to place stop loss on Zerodha Kite
Zerodha is India’s largest stockbroker, and most retail traders in India use Zerodha Kite. Here’s exactly how to place a stop loss order once you’ve calculated your level using the stop loss calculator for Zerodha.
Step-by-step: Place SL order on Zerodha Kite
- Log in to Kite and search for your stock or index
- Click Buy or Sell to open the order window
- Change the order type from “Market” or “Limit” to “SL” (Stop Loss Limit) or “SL-M” (Stop Loss Market)
- Enter your Trigger Price — this is the stop loss price from your calculator
- If using SL (not SL-M): also enter a Limit Price slightly below the trigger (e.g., trigger = ₹490, limit = ₹488)
- Enter quantity and click Place Order
For intraday trades, Kite also has a Good Till Triggered (GTT) feature for delivery trades — this lets you set a stop loss that stays active until it’s triggered or you cancel it manually.
If you’re unsure about the brokerage charges on your stop loss triggered trades, the brokerage calculator on MoneyOra shows exact charges for Zerodha and other brokers.
Common mistakes traders make with stop loss
Setting a stop loss is not enough. Where you set it and how you manage it matters just as much. Here are the most common errors that cost traders money.
1. Setting stop loss too tight
A stop loss at 0.5% on a stock with 2% daily volatility will be triggered almost every day. You’ll rack up small losses constantly and miss the big winning moves. Always check ATR before setting a tight stop.
2. Moving stop loss further away
This is the most dangerous habit in trading. When a trade goes against you and approaches your stop, moving the stop further away turns a calculated loss into an uncontrolled one. Set it. Leave it.
3. Not using stop loss at all
Some traders skip stop loss in the belief that their stock “will come back.” This sometimes works — but once or twice it will result in an 80–90% loss on a single position. Capital preservation matters more than any individual trade.
4. Setting round-number stops
Retail traders tend to place stops at round numbers — ₹500, ₹1,000, $50,000. Professional traders know this and often push price through those levels to trigger stops before reversing. Avoid obvious round numbers. Use ATR or structural levels instead.
5. Using the same stop loss percentage for all markets
A 2% stop loss makes sense for a large-cap Indian stock. It doesn’t make sense for Bitcoin (too tight) or for a low-volatility bond fund (too wide). Use asset-specific volatility data to calibrate your stop.
6. Ignoring brokerage and slippage costs
Your stop loss calculator tells you the risk before costs. On a short-duration intraday trade, brokerage and taxes can add 0.2–0.5% to your actual loss. Factor this in, especially on smaller accounts. The brokerage calculator at MoneyOra makes this easy.
Pro tips for smarter stop loss placement
These are the habits that separate consistently profitable traders from those who struggle.
- Always calculate stop loss before entering a trade, not after. Once you’re in, emotions cloud judgment.
- Size your position based on your stop loss, not the other way around. Use the position size calculator to get this right every time.
- Use daily ATR as your baseline. For intraday trades, use hourly ATR instead.
- Place stops just below key structure, not exactly at it. Markets often probe support before reversing — give it 0.3–0.5% of breathing room.
- Review your stopped-out trades. If 80% of your stops trigger before the market moves in your favour, your stops are too tight. If they rarely trigger, they may be too wide.
- Combine stop loss with take profit. MoneyOra’s take profit and stop loss calculator lets you set both levels and calculate your risk-reward ratio before placing the trade. Aim for at least 2:1 reward-to-risk.
- For SIP investors: stop loss logic applies differently. Instead of price-based exits, SIP investors should review their portfolio against benchmarks annually. Use the SIP calculator to model returns and set realistic expectations.
Stop loss methods comparison table
Not sure which stop loss method to use? This table compares all 7 methods across the metrics that matter most.
| Method | Best for | Complexity | Respects volatility? | Works for crypto? | Works for forex/XAUUSD? |
|---|---|---|---|---|---|
| Percentage-based | Beginners, all markets | Low | No | Partially | Yes |
| ATR-based | All markets, professionals | Medium | Yes | Yes | Yes |
| Support/resistance | Stocks, swing trading | Medium | Partially | Yes | Yes |
| Moving average | Swing & position trading | Low | Partially | Yes | Yes |
| Trailing stop loss | Trending markets | Medium | Partially | Yes | Yes |
| Fixed rupee/dollar | Fixed-budget traders | Low | No | Yes | Yes |
| Candlestick-based | Price action traders | High | Yes | Partially | Yes |
For most retail traders in India, the ATR-based stop loss paired with a fixed risk percentage (1–2% of account) gives the best balance between protection and staying power in a trade.
Stop loss in the context of your overall financial plan
Trading is only one part of a complete financial strategy. Most financial advisors recommend that active trading make up a small portion of your overall portfolio — typically 10–20% — while the rest stays in diversified investments.
For the non-trading portion of your portfolio, compounding works better than stop losses. Tools like the FD calculator show fixed deposit returns over time, the PPF calculator models Public Provident Fund growth, and the NPS calculator helps you plan your National Pension System contributions.
If you’re also managing loans, the EMI calculator helps you balance loan repayments against trading capital. A home loan EMI calculator and personal loan EMI calculator both help you see exactly how much of your monthly income goes toward debt — important context when deciding how much capital to allocate to active trading.
For long-term wealth builders, the lumpsum calculator and SWP calculator (Systematic Withdrawal Plan) are useful for understanding how invested capital grows and how to take regular withdrawals in retirement.
The dividend calculator and PE ratio calculator round out the toolkit for equity investors who want to evaluate individual stocks beyond just technical analysis.
And if you’re in a new city or need to verify a bank account before making a fund transfer, MoneyOra’s IFSC code finder and bank details finder are quick reference tools that save a trip to the branch.
For regular savers, the RD calculator (Recurring Deposit) and EPF calculator (Employee Provident Fund) show how disciplined monthly contributions build wealth over time — a slow, steady alternative to the faster-but-riskier world of active trading where stop losses matter every day.
Conclusion
A stop loss calculator is not a luxury for advanced traders. It’s the foundation of any trading strategy that survives long enough to profit. Without knowing exactly how much you’re risking on each trade, you’re not trading — you’re gambling.
Whether you trade Nifty stocks, XAUUSD gold on forex, Bitcoin, or Nifty options, the math is the same: decide your risk before you enter, use a calculator to find your stop loss price, and place the order. Then leave it alone.
The markets reward discipline. The stop loss is your most basic act of discipline.
Try MoneyOra’s free stop loss calculator now. It handles stocks, forex, crypto, options, and futures — with instant results and no sign-up required.
While you’re there, also check the position size calculator to complete your trade setup. Know your stop. Know your size. Enter with a plan.
Start using MoneyOra’s stop loss calculator today — free, fast, and built for Indian traders.
 Calculate your stop loss now
Frequently Asked Questions About Stop Loss Calculator
A stop loss calculator helps traders manage risk.
It finds the exact exit price for losing trades.
You enter entry price, position size, and risk amount.
The calculator gives a stop loss price.
This keeps losses within your limit.
Use the percentage method.
Stop Loss = Entry Price × (1 − Risk%).
Example: ₹500 entry with 2% risk gives ₹490 stop loss.
You can also use ATR-based stop loss.
This adjusts for market volatility.
Most traders use 0.5% to 1.5% range.
Beginners often use 1%.
This helps control losses.
It also allows learning without large risk.
It uses entry price, stop loss in pips, and lot size.
It calculates potential loss in money terms.
It also converts into account currency.
This helps manage forex risk properly.
Trailing stop moves with price.
It locks in profits as price rises.
Fixed stop stays at one level.
Trailing works well in trending markets.
Fixed works better in sideways markets.
Yes, it works for crypto trading.
Enter entry price and position size.
Use risk percentage to set stop loss.
Crypto is volatile.
Traders use 3–5% or ATR-based stops.
ATR means Average True Range.
It measures market volatility.
Stop loss = Entry Price − (ATR × multiplier).
Multiplier is usually 1.5x to 2x.
This avoids unnecessary stop hits.
Use SL-M or SL order type.
Enter your trigger price.
This is your stop loss level.
Kite exits trade automatically.
Stop loss is based on premium.
Exit if premium falls 30–50%.
Example: buy at ₹100, stop at ₹50–₹70.
This limits loss effectively.
Stop loss works most of the time.
Fast markets can cause slippage.
Execution may be at a worse price.
Stop-limit orders help control price.
Important in volatile markets.