
SIP & Lumpsum
Calculator
Estimate wealth creation from systematic & one-time investments — with year-by-year projections.
| Year | Invested | Returns | Corpus | CAGR |
|---|
SIP Calculator: Best Free Tool to Plan Your Mutual Fund Returns in India
If you have ever wondered how much your monthly savings could grow into over 10 or 20 years, a SIP calculator is the one tool you need. “what happens to your SIP during a market crash — see the real historical data” Whether you are just starting out with ₹500 a month or planning a serious ₹50,000 monthly investment in mutual funds, financial mistakes freshers make this free online tool tells you exactly what to expect — no guesswork, no complicated math.
India’s mutual fund industry crossed ₹79.9 lakh crore in AUM in October 2025, and monthly SIP contributions hit a record ₹29,529 crore — with over 9.45 crore active SIP accounts, according to AMFI (Association of Mutual Funds in India). In short, tens of millions of Indians are already using SIPs to build wealth. And a SIP calculator is what helps them plan it right. “why today’s share market correction is actually good for SIP investors”
In this guide, you will learn what a SIP calculator is, how to use it, what formula it uses, and how to plan real-life goals like saving ₹1 crore or ₹50 lakh. You will also find worked examples, a comparison table for SIP vs Lumpsum, common mistakes to avoid, and answers to the most searched questions about SIP investment in India. “why SIP avoids brokerage charges compared to direct stock trading”
What is a SIP Calculator?
A SIP calculator (Systematic Investment Plan calculator) is a free online tool that estimates the future value of your mutual fund investments made through regular monthly contributions. You enter three inputs — how much you invest per month, the expected annual return rate, and how many years you plan to invest — and the calculator instantly shows your estimated wealth gain and total maturity value. “SIP into AI stocks India — compare equity SIP returns vs direct AI stock investment”
Think of it like this: you are planting a seed every month. The SIP calculator shows you how big the tree grows by the time you are ready to harvest. It takes the power of compounding and makes it visible in seconds.
It does not require any finance degree to use. You do not need to understand complex formulas. You just punch in three numbers and get your answer. That is the whole point of using a mutual fund SIP calculator like MoneyOra’s.
What Does a SIP Calculator Show You?
A standard SIP calculator gives you three numbers:
- Total amount invested — the sum of all your monthly contributions over the full tenure
- Estimated returns — how much your money grew on top of what you put in
- Total maturity value — your invested amount plus your estimated returns combined
Some advanced SIP calculators, including the one on MoneyOra, also show you a year-by-year growth breakdown so you can see the compounding effect working in real time. “Netweb Technologies India — how AI infrastructure stocks compare to SIP returns”
How Does a SIP Calculator Work?
The SIP calculator works on the principle of compound interest. Unlike a simple interest calculation, compound interest means you earn returns not just on the money you put in, but also on the returns you already earned. “build a complete salary investment plan around your SIP” Over long periods, this effect becomes very powerful.
Every month when your SIP instalment goes in, it starts earning returns from that month onward. “see how ₹100 per day investment grows over 10, 20 and 30 years” The first instalment earns returns for the entire investment period. The last instalment earns returns only for one month. The calculator adds up all these individual returns together to give you the total maturity amount.
This is also why starting a SIP early — even with a small amount — matters so much more than starting late with a larger amount. A 25-year-old investing ₹5,000 per month will likely end up with more money at 60 than a 35-year-old investing ₹10,000 per month, because of the additional years of compounding. “gold reserve in India — why RBI keeps buying and what it means for your gold SIP”
SIP Formula Explained (with Example)
The formula a SIP return calculator uses is based on the future value of an annuity. Here is the standard SIP maturity formula:
M = P × [{(1 + r)^n – 1} / r] × (1 + r)
- M = Maturity value (what you get at the end)
- P = Monthly SIP amount (how much you invest per month)
- r = Monthly interest rate (annual rate ÷ 12 ÷ 100)
- n = Total number of months (years × 12)
Quick Example: ₹5,000 Monthly SIP for 10 Years at 12%
| Input | Value |
|---|---|
| Monthly SIP Amount (P) | ₹5,000 |
| Annual Return Rate | 12% |
| Monthly Return Rate (r) | 12% ÷ 12 = 1% = 0.01 |
| Tenure | 10 years = 120 months (n) |
| Total Amount Invested | ₹6,00,000 |
| Estimated Returns | ₹5,61,695 |
| Maturity Value (M) | ≈ ₹11,61,695 |
That means you put in ₹6 lakh and potentially walk away with nearly ₹11.6 lakh — almost double your investment, without any effort after the initial setup.
You can verify these numbers yourself using MoneyOra’s free SIP calculator — it does the math instantly.

How to Use MoneyOra's SIP Calculator
Using the SIP investment calculator on MoneyOra is straightforward. Here is what you do:
- Enter your monthly SIP amount — this is how much you plan to invest every month. You can start as low as ₹500.
- Set the expected return rate — a common assumption for equity mutual funds is 10–12% annually. For debt funds, use 6–7%.
- Choose your investment tenure — enter the number of years you plan to stay invested. Options typically range from 1 year to 30 years.
- Hit Calculate — the tool instantly shows your total invested amount, estimated returns, and total maturity value.
The whole process takes about 15 seconds. No sign-up required, no ads, completely free.
SIP Calculation Examples (Real Numbers)
Numbers make things real. Here are some worked examples using different monthly SIP amounts and tenures. All estimates use a 12% expected annual return rate, which is a common long-term average for equity mutual funds in India. (Actual returns vary with market conditions.)
Example 1: ₹1,000 SIP for 5 Years
| Parameter | Value |
|---|---|
| Monthly SIP | ₹1,000 |
| Tenure | 5 years |
| Expected Return | 12% p.a. |
| Total Invested | ₹60,000 |
| Estimated Maturity | ≈ ₹82,486 |
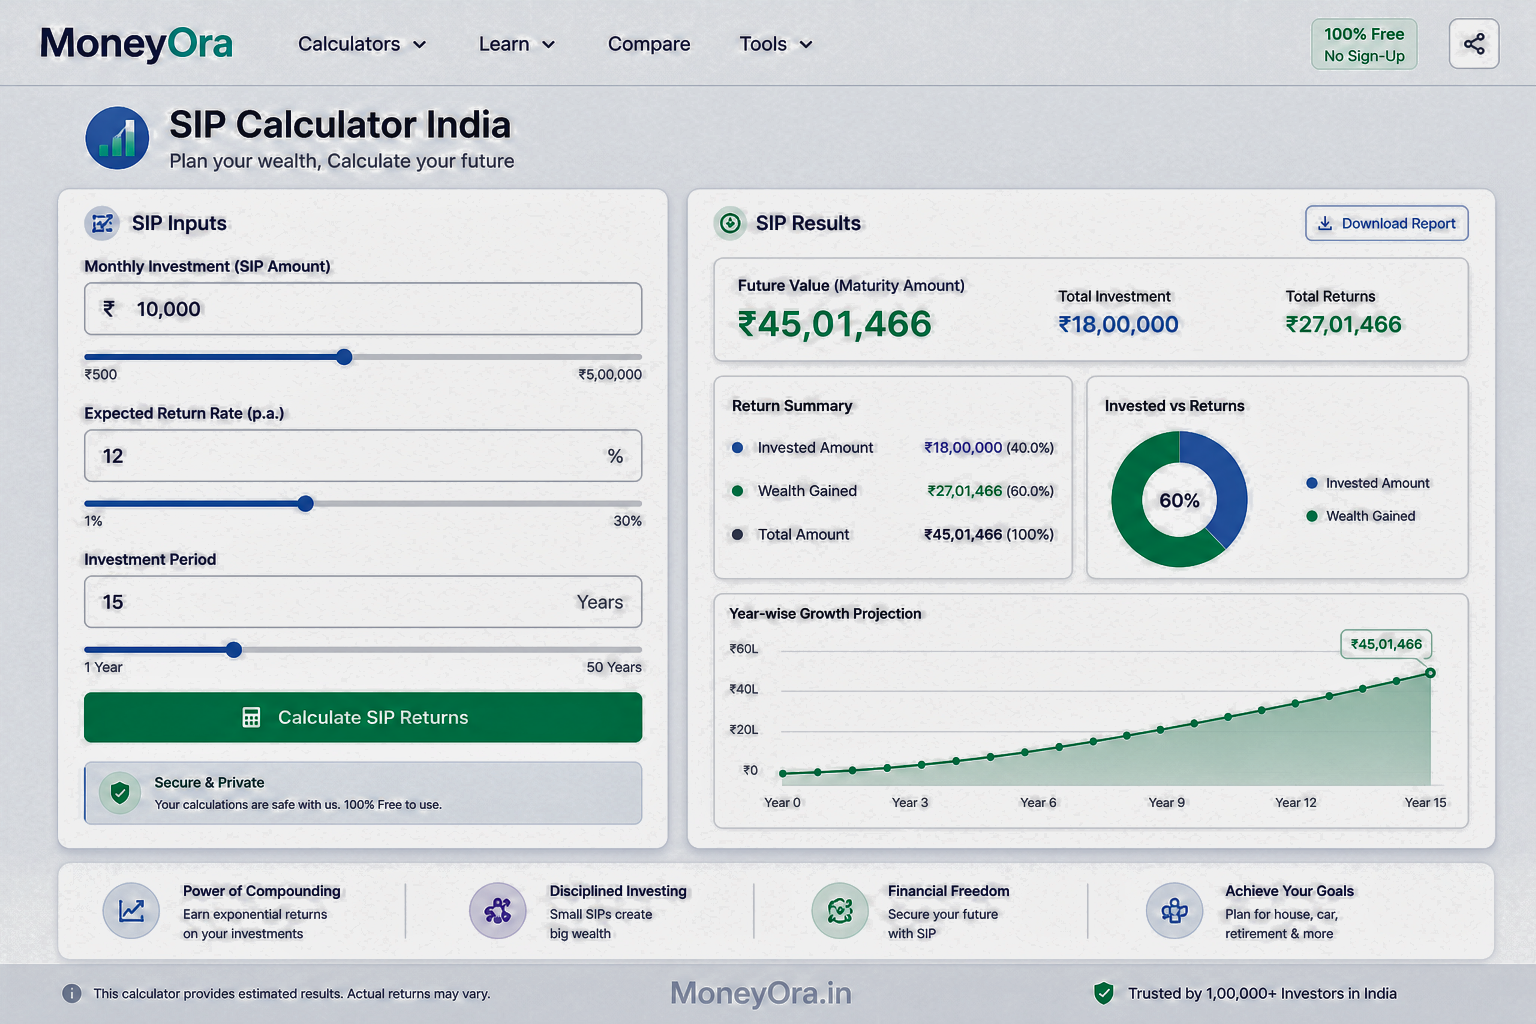
Example 2: ₹5,000 SIP for 15 Years
| Parameter | Value |
|---|---|
| Monthly SIP | ₹5,000 |
| Tenure | 15 years |
| Expected Return | 12% p.a. |
| Total Invested | ₹9,00,000 |
| Estimated Returns | ≈ ₹16,22,880 |
| Estimated Maturity | ≈ ₹25,22,880 |
Example 3: ₹2,000 SIP for 20 Years
| Parameter | Value |
|---|---|
| Monthly SIP | ₹2,000 |
| Tenure | 20 years |
| Expected Return | 12% p.a. |
| Total Invested | ₹4,80,000 |
| Estimated Returns | ≈ ₹15,18,000 |
| Estimated Maturity | ≈ ₹19,98,000 |
Example 4: ₹10,000 SIP for 20 Years
| Parameter | Value |
|---|---|
| Monthly SIP | ₹10,000 |
| Tenure | 20 years |
| Expected Return | 12% p.a. |
| Total Invested | ₹24,00,000 |
| Estimated Maturity | ≈ ₹99,91,478 (≈₹1 crore) |
You can run any of these scenarios in seconds on MoneyOra’s SIP calculator.
Goal-Based SIP Planning: How Much Do You Need?
Most people do not think about SIP as a tool. They think about goals — a child’s education, a house down payment, retirement, a foreign holiday. The SIP maturity calculator works in reverse too: tell it your goal amount and timeline, and it tells you how much to invest each month.
How to Accumulate ₹1 Crore via SIP
| Timeline | Monthly SIP Required (at 12% return) |
|---|---|
| 10 years | ≈ ₹43,000/month |
| 15 years | ≈ ₹20,000/month |
| 20 years | ≈ ₹10,000/month |
| 25 years | ≈ ₹5,300/month |
| 30 years | ≈ ₹2,900/month |
Notice how time is the single biggest factor here. Someone who invests for 30 years needs to put in only ₹2,900 per month to reach ₹1 crore — while someone starting 20 years later needs ₹43,000 per month for the same result. This is the power of compounding in SIP, and why starting today (even with a small amount) beats starting later with a bigger amount.
How to Accumulate ₹50 Lakh via SIP
| Timeline | Monthly SIP Required (at 12% return) |
|---|---|
| 5 years | ≈ ₹61,000/month |
| 10 years | ≈ ₹21,500/month |
| 15 years | ≈ ₹10,000/month |
| 20 years | ≈ ₹5,000/month |
If you are also comparing your SIP growth against other savings instruments, check out MoneyOra’s FD calculator and PPF calculator to see how fixed-income options compare over the same tenure.

SIP vs Lumpsum Investment: Key Differences
This is one of the most common questions people have. Should you invest a large amount all at once (lumpsum), or spread it over monthly installments (SIP)? The answer depends on your situation.
| Factor | SIP | Lumpsum |
|---|---|---|
| Investment pattern | Regular monthly installments | One-time investment |
| Minimum amount | As low as ₹500/month | Usually ₹1,000 or more |
| Market timing risk | Low — rupee cost averaging | High — depends on entry point |
| Best for | Salaried investors, beginners | Windfall income, experienced investors |
| Flexibility | High — can pause or change amount | Low — full commitment upfront |
| Returns (good market) | Slightly lower than lumpsum | Higher if timed right |
| Returns (bad market) | Better — benefits from lower NAV | Worse — full capital exposed |
| Discipline building | Yes — auto-debit creates habit | No ongoing discipline needed |
For most salaried people in India, SIP is the right default. If you get a bonus or an inheritance, consider a combination — invest a lumpsum and continue your regular SIP. You can calculate both scenarios using the MoneyOra Lumpsum Calculator alongside the SIP calculator.
According to Wikipedia’s article on Systematic Investment Plans, rupee cost averaging is one of the core advantages of SIP investing — you buy more units when prices are low and fewer when prices are high, naturally averaging your purchase cost over time.
Benefits of SIP Investment in Mutual Funds
SIP is not just popular because it sounds smart. It works because it solves real problems that most investors face.
1. You Do Not Need a Large Amount to Start
You can begin a SIP with as little as ₹500 per month. Some fund houses even offer SIPs from ₹250 per month under the Chhoti SIP initiative. This removes the biggest barrier for new investors — the feeling that you need a lot of money to start investing.
2. No Need to Time the Market
The number one mistake investors make is waiting for the “right time” to invest. With SIP, you invest every month regardless of market conditions. When markets fall, you buy more units. When markets rise, your existing units gain value. Over time, this smooths out the volatility.
3. Power of Compounding Works in Your Favour
Every rupee you invest starts earning returns. Then your returns earn returns. This compounding effect is modest in year 1 but becomes dramatic by year 10, 15, or 20. The longer you stay invested, the more exponential the growth gets.
4. Tax Benefits (ELSS SIPs)
If you invest in Equity Linked Savings Scheme (ELSS) funds through SIP, you get a tax deduction of up to ₹1.5 lakh per year under Section 80C of the Income Tax Act. This makes ELSS SIPs one of the most efficient tax-saving tools for investors with a 3-year lock-in period.
5. Complete Flexibility
You can increase, decrease, pause, or stop your SIP at any time. There is no penalty for stopping (though early termination can reduce your long-term returns). This flexibility makes SIPs far more practical than many other commitment-based saving instruments.
What is Step-Up SIP? (And Why You Should Use It)
A step-up SIP (also called a top-up SIP) lets you increase your monthly SIP amount by a fixed percentage or fixed amount every year. This is a powerful strategy for salaried investors whose income grows with time.
Example: Regular SIP vs Step-Up SIP
| Parameter | Regular SIP | Step-Up SIP (10% annual increase) |
|---|---|---|
| Starting monthly SIP | ₹5,000 | ₹5,000 |
| Tenure | 20 years | 20 years |
| Expected return | 12% p.a. | 12% p.a. |
| Total invested | ₹12,00,000 | ≈ ₹34,36,500 |
| Estimated maturity | ≈ ₹49,96,000 | ≈ ₹1,05,00,000+ |
The logic is simple: as your salary grows, so should your investment. If you get a 10% hike every year, routing even a fraction of it into your SIP can more than double your wealth at retirement.
Pro Tips for Getting More from Your SIP
Tip 1: Start Now, Not “Next Month”
Every month you delay is compounding you are giving up. Seriously. A 25-year-old investing ₹5,000/month until 60 (35 years) at 12% ends up with around ₹3.2 crore. Starting the same SIP at 30 gets you about ₹1.76 crore. Five years of delay costs you over ₹1.4 crore.
Tip 2: Do Not Stop SIP During Market Falls
When markets crash, most investors panic and stop their SIPs. This is the exact opposite of what helps you. Market falls mean you are buying mutual fund units at a discount. The best SIP returns often come from units bought during market downturns.
Tip 3: Review, But Do Not Over-Manage
Check your SIP portfolio once a year. Rebalance if one fund has grown disproportionately. But do not check it every week and change funds based on short-term performance. SIP rewards patience above everything else.
Tip 4: Use a Goal-Based Approach
Instead of just “saving for the future,” link each SIP to a specific goal — retirement corpus, child’s college fees, car purchase in 5 years. This makes it easier to stay committed and choose the right fund type for each goal’s timeline.
Tip 5: Use Multiple Calculators to Plan Holistically
SIP is one piece of your financial plan. Use the Recurring Deposit calculator for your emergency fund, the NPS calculator for retirement planning, and the EPF calculator for your provident fund. All these are free on MoneyOra.
Common SIP Mistakes Most Investors Make
Mistake 1: Using a SIP Calculator but Ignoring Inflation
A SIP calculator shows you nominal returns. But ₹1 crore in 20 years will not buy what ₹1 crore buys today. Always factor in inflation (currently around 4–6% in India) when setting your target corpus. Your real return rate is roughly: nominal return minus inflation rate.
Mistake 2: Choosing a Fund Based on Last Year’s Returns
A fund that gave 35% returns last year might give –15% this year. Past performance does not guarantee future results. Instead, look at a fund’s 5-year and 10-year CAGR, fund manager experience, and risk ratings. You can check CAGR figures using MoneyOra’s CAGR calculator.
Mistake 3: Starting Multiple SIPs and Not Tracking Any
It is fine to run 3–4 SIPs across different fund categories. But more than 6–7 SIPs often becomes unmanageable, leads to overlapping portfolios, and dilutes focus. Start with 2–3 well-chosen funds and add more only when you have clarity on your goals.
Mistake 4: Stopping SIP Before the Goal Is Reached
This is the most expensive mistake. Stopping a SIP 2 years before your target date means missing out on the highest-growth period — because the largest compounding returns come in the final years of a long SIP.
Mistake 5: Ignoring SWP (Systematic Withdrawal Plan) at Redemption
When your SIP matures and you start drawing down, a lumpsum withdrawal can put you in a high tax bracket. A smarter approach is a Systematic Withdrawal Plan (SWP), which lets you withdraw a fixed monthly amount — saving tax and keeping the rest of your corpus invested.
Other Financial Calculators You Should Know About
MoneyOra is not just a SIP calculator. It has a full suite of free financial planning tools. Here are some that work well alongside your SIP planning:
For Loan Planning
If you are balancing an EMI and a SIP at the same time, use the EMI calculator to know exactly what your loan repayment looks like. Specific calculators for your home loan EMI, car loan EMI, and personal loan EMI are all available.
For Stock Market Investors
If you invest in stocks alongside mutual funds, MoneyOra’s stock tools are useful. Check your portfolio gains with the stock return calculator, manage position sizing with the position size calculator, limit your downside using the stop-loss calculator, and evaluate stock valuation using the P/E ratio calculator.
For Long-Term Savings
Compare your SIP growth against the PPF calculator (15-year government-backed savings) and the FD calculator. If you invest in dividends, the dividend calculator helps you estimate income from dividend-paying stocks and funds.
For Advanced Investors
Options traders can use the option price calculator, the margin calculator, and the brokerage calculator. If you are averaging into a stock position, the stock average calculator tells you your new average cost instantly.
The Reserve Bank of India (RBI) also provides detailed guidelines on mutual fund regulations and investor rights — worth reading if you are new to the world of SIP investing in India.
Conclusion: Start Planning Your SIP Today
A SIP calculator takes the mystery out of long-term investing. Whether you are a student putting in ₹500 per month or a senior professional investing ₹50,000, the tool works the same way — it shows you what patience and consistency look like in rupees.
India’s SIP culture is only growing. Monthly SIP contributions crossed ₹31,000 crore in December 2025 according to AMFI data — a 46% year-on-year increase. The people driving that number are not all finance experts. Most of them are ordinary earners who simply decided to start and stay consistent.
The best time to start a SIP was ten years ago. The second best time is right now.
Use MoneyOra’s free SIP calculator to find your numbers. Then compare your growth potential against the lumpsum calculator, check your loan situation with the EMI calculator, and build a full financial plan using all the free tools MoneyOra offers.
No cost, no sign-up, no ads. Just the numbers you need to make better decisions with your money.
Disclaimer: All SIP return calculations on this page are estimates based on assumed annual return rates and are for illustrative purposes only. Actual mutual fund returns vary with market conditions. Mutual fund investments are subject to market risks. Please read all scheme-related documents carefully before investing. This article does not constitute financial advice.
Frequently Asked Questions About SIP Calculator
A SIP calculator is a free online tool.
It estimates the future value of your investments.
It works for monthly SIP contributions.
You enter monthly amount, return rate, and duration.
It shows maturity value and expected returns instantly.
It uses the compound interest formula for annuity.
M = P × [{(1 + r)^n – 1} / r] × (1 + r).
It accounts for monthly contributions.
It includes compounding returns.
It calculates projected maturity value.
At 12% return, ₹2,000 per month grows significantly.
After 20 years, value is around ₹19.98 lakh.
Total investment is ₹4.80 lakh.
Estimated gains are ₹15.18 lakh.
This is nearly 4× growth.
At 12% return, monthly SIP required is ₹61,000–₹65,000.
Five years is a short period.
Market performance plays a big role.
For 10 years, SIP requirement drops significantly.
It becomes around ₹21,500 per month.
At 12% return, ₹1,000 monthly grows to ₹82,486.
Total investment is ₹60,000.
Returns are approximately ₹22,486.
At 12% return, ₹5,000 monthly becomes ₹25.23 lakh.
Total investment is ₹9 lakh.
Estimated returns are ₹16.23 lakh.
FDs give fixed returns of 6–7.5%.
SIPs in equity funds offer higher returns.
They can deliver 10–15% over long periods.
SIPs carry market risk.
For long-term goals, SIP is generally better.
M = P × [{(1 + r)^n – 1} / r] × (1 + r).
M is maturity value.
P is monthly investment.
r is monthly return rate.
n is total months.
Yes, SIP can be stopped anytime.
You can cancel through your broker or fund house.
Stopping early reduces compounding benefits.
Long-term continuation gives better growth.
Rupee cost averaging spreads your investment.
You buy more units when price is low.
You buy fewer units when price is high.
This reduces overall cost.
It helps manage market volatility.