
Stock Average
Calculator
Calculate your average buy price across multiple purchases — with P&L, cost breakdown & CMP analysis.
| # | Buy Price | Quantity | Investment | Cum. Qty | Cum. Invested | Running Avg | % of Total |
|---|
Stock Average Calculator: What's Your Real Buy Price After Multiple Purchases?
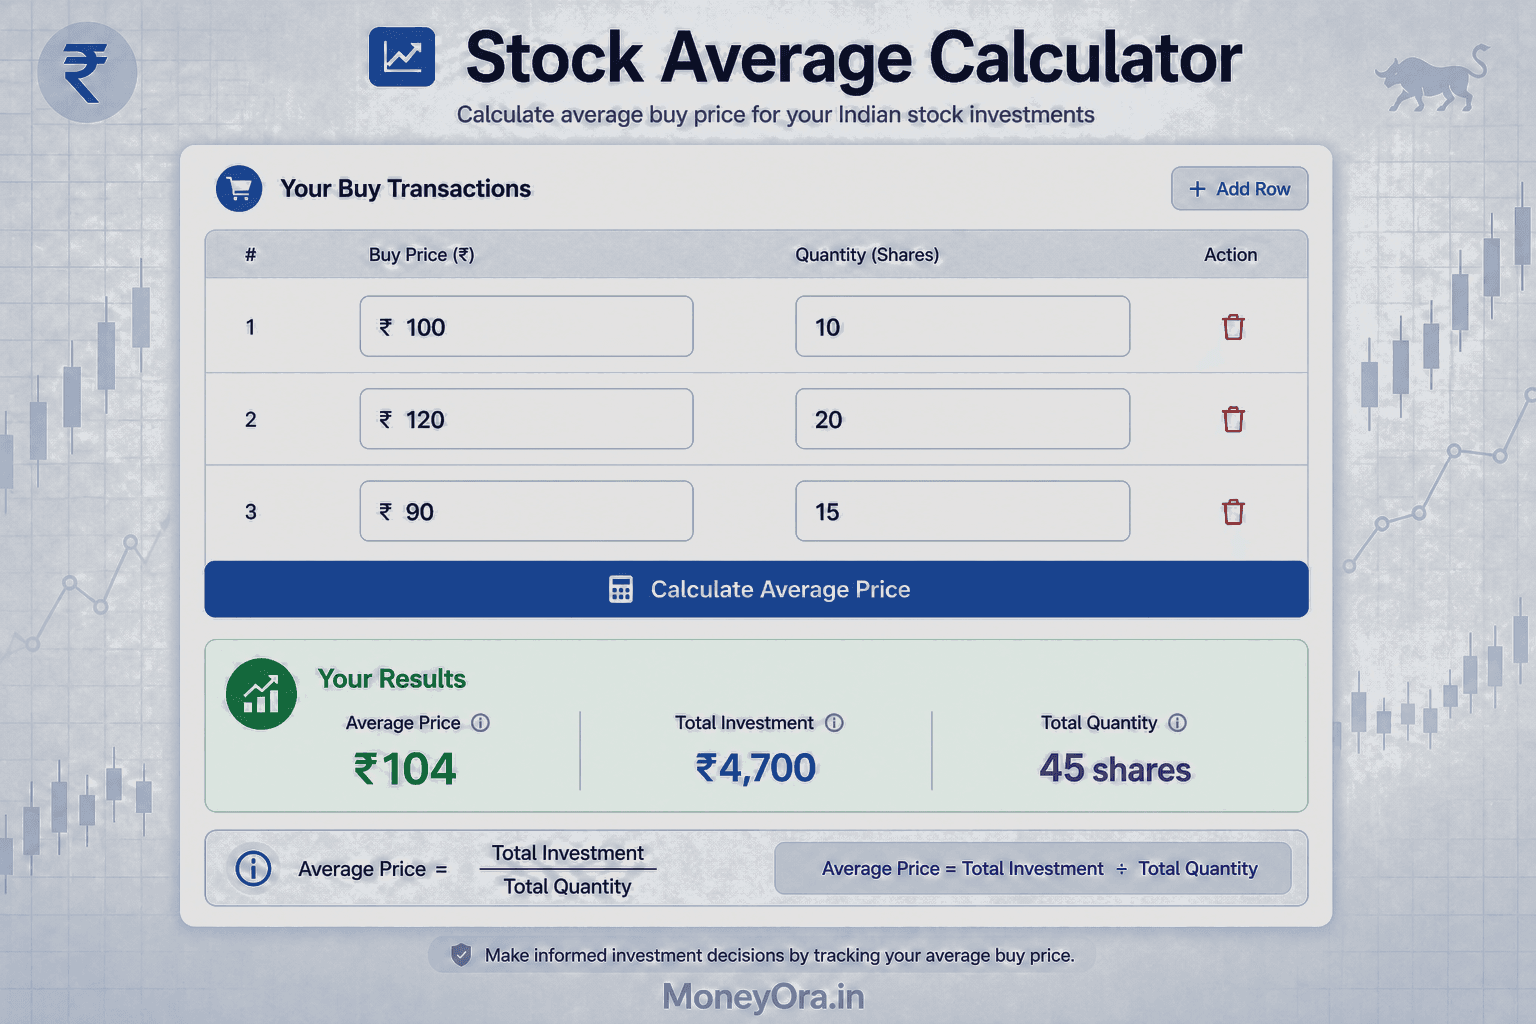
Say you bought 50 shares of a company at ₹200. A month later the price dropped to ₹160 and you bought 30 more. Now what is your average buying price? Not ₹200. Not ₹160. Somewhere in between — but exactly where?
Most people guess. A few open Excel. Both approaches waste time and often get it wrong. A stock average calculator solves this in seconds: enter your purchase prices and quantities, and you get your exact weighted average cost per share, no spreadsheet required.
This guide covers the formula, walks through real examples with actual Indian stocks, compares stock average calculators across Zerodha, Groww, and Angel One, and explains when averaging down actually makes sense — and when it is quietly destroying your portfolio. The MoneyOra Stock Average Calculator is free, needs no login, and works for Indian and US stocks alike.
What Is a Stock Average Calculator?
A stock average calculator tells you your weighted average purchase price across multiple buy transactions on the same stock. You might also see it called a share average calculator, average cost calculator for stocks, or average buying price calculator — different names, same job.
Here is the thing people get wrong. If you bought shares at ₹100, ₹80, and ₹60, the average is not simply ₹80. That is a simple average, and it only works if you bought the same number of shares each time. In practice you almost never do. You might have bought 10 shares at ₹100 and 100 shares at ₹60 — your real average is much closer to ₹63, not ₹80.
A stock average calculator handles this automatically using the weighted average method. Give it your prices and quantities, it does the rest.
Quick answer: Stock average calculator = Total amount invested ÷ Total shares bought. It accounts for how many shares you bought at each price, not just the prices themselves.
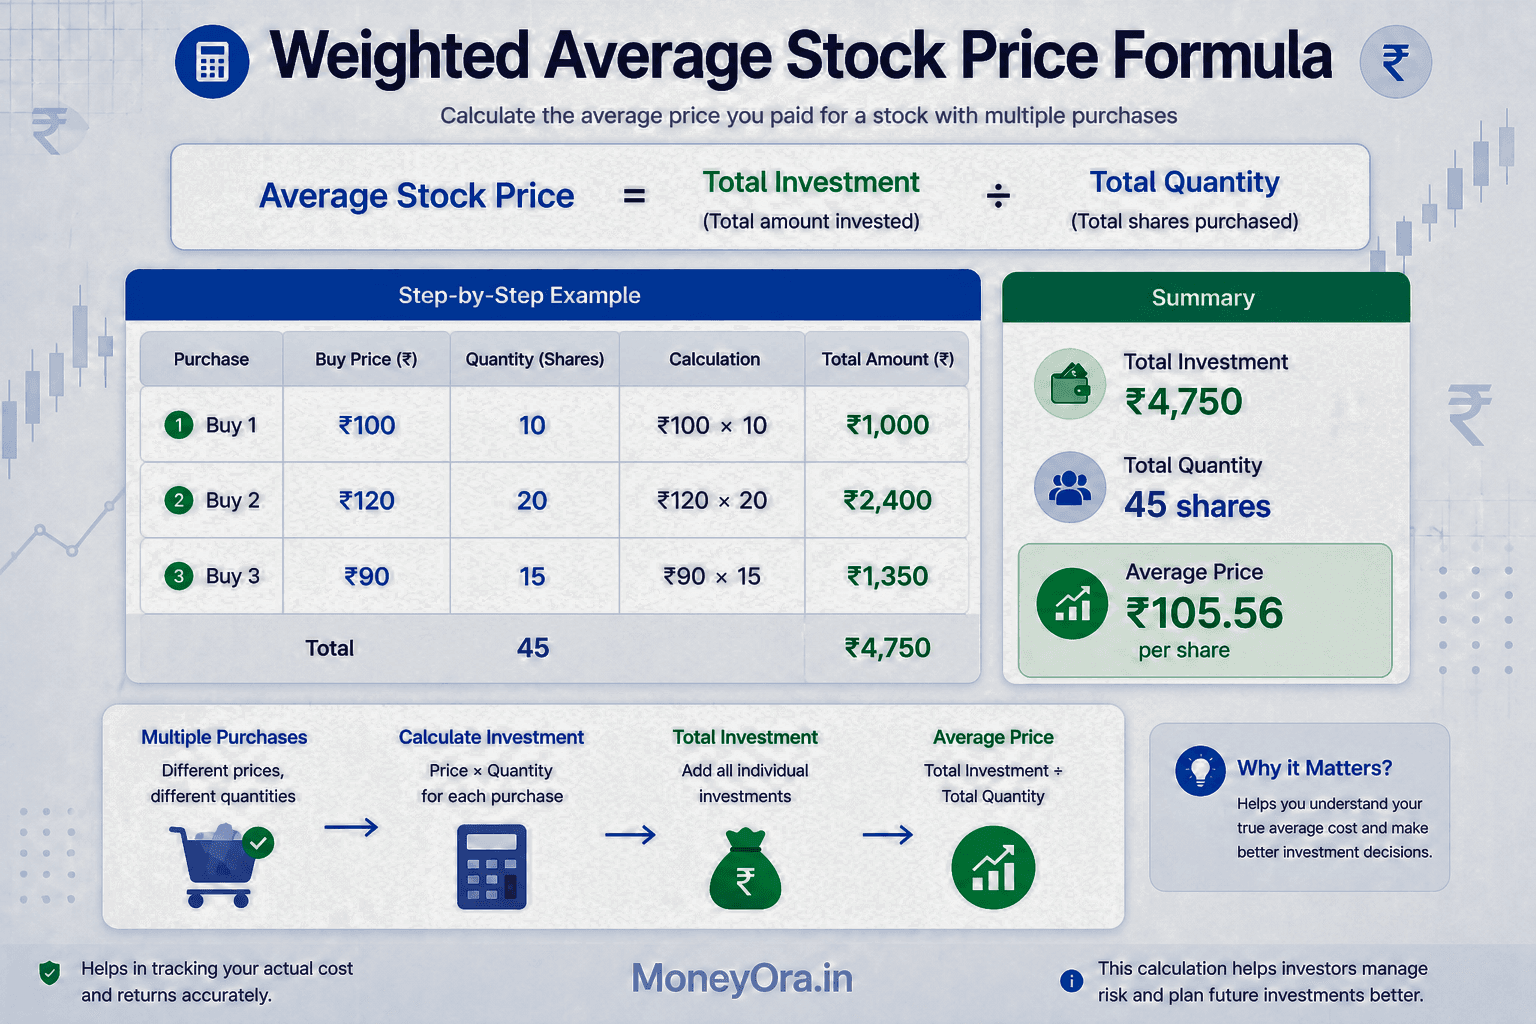
The Stock Average Formula
Every broker — Zerodha, Groww, Angel One, Dhan — uses the same underlying formula. Here it is:
Average Share Price = Total Investment ÷ Total Shares
Total Investment = (Price₁ × Qty₁) + (Price₂ × Qty₂) + … + (Priceₙ × Qtyₙ)
Total Shares = Qty₁ + Qty₂ + … + Qtyₙ
This is also the math behind dollar-cost averaging (DCA), a strategy popular among long-term investors globally, where you invest a fixed amount at regular intervals regardless of the current price.
Why Weighted Average Beats Simple Average
If you bought 10 shares at ₹500 and 100 shares at ₹300, a simple average gives ₹400. That sounds reasonable but it is wrong. Your actual average is ₹318 — because 100 of your 110 shares were bought at ₹300. The weighted average stock price formula reflects what you actually paid.
This number matters when you are calculating profit or loss, filing taxes, or deciding whether to hold or exit.
How to Calculate Average Stock Price (Step-by-Step)
You can do this by hand or let the stock average calculator handle it. Here is the manual process so you understand what the tool is actually doing:
- List every purchase: price paid and number of shares bought each time.
- Multiply price × quantity for each buy. This gives you the rupee amount per transaction.
- Add all those amounts. That is your total investment.
- Add all the quantities. That is your total number of shares.
- Divide total investment by total shares. Done — that is your average share price.
With MoneyOra’s calculator you skip steps 2 through 5. Add as many purchase rows as you need, hit calculate, and the answer appears immediately.
Real Examples: Stock Average Calculation with Indian Stocks
Numbers make this clearer. Let us look at a few realistic scenarios Indian investors actually deal with.
Example 1: Averaging Down on Infosys
You bought Infosys shares three times as the price corrected:
| Transaction | Buy Price (₹) | Qty (Shares) | Amount Invested (₹) |
|---|---|---|---|
| Buy 1 | 1,800 | 10 | 18,000 |
| Buy 2 | 1,600 | 15 | 24,000 |
| Buy 3 | 1,400 | 25 | 35,000 |
| Total | — | 50 | 77,000 |
Average price = ₹77,000 ÷ 50 = ₹1,540 per share
Your first buy is still underwater at ₹1,800 vs. the current market price. But your overall position breaks even at ₹1,540 — a number the market can realistically reach much sooner. If Infosys trades at ₹1,700 today, you are up ₹8,000 (about 10.4%) on the full holding. Without the second and third purchases, you would be down ₹10,000.
You can check exact returns on any scenario using the Stock Return Calculator.
Example 2: Stock Average Calculator with Profit Calculation
Once you have your average price, profit or loss is straightforward:
- Current market price: ₹1,700
- Current value: 50 × ₹1,700 = ₹85,000
- Total invested: ₹77,000
- Profit: ₹8,000 (10.4% return)
Example 3: Penny Stock Average Calculator
Penny stocks are a different game. Prices move sharply and the risks of averaging are higher. Still, the same formula applies:
| Buy | Price (₹) | Qty | Amount (₹) |
|---|---|---|---|
| Buy 1 | 12 | 500 | 6,000 |
| Buy 2 | 9 | 800 | 7,200 |
| Buy 3 | 6 | 1,200 | 7,200 |
| Total | — | 2,500 | 20,400 |
Average price = ₹20,400 ÷ 2,500 = ₹8.16 per share
Breakeven at ₹8.17 is far more achievable than recovering all the way to ₹12. That said — whether a penny stock ever reaches ₹8.17 is a different question entirely. The math works. The stock has to cooperate.
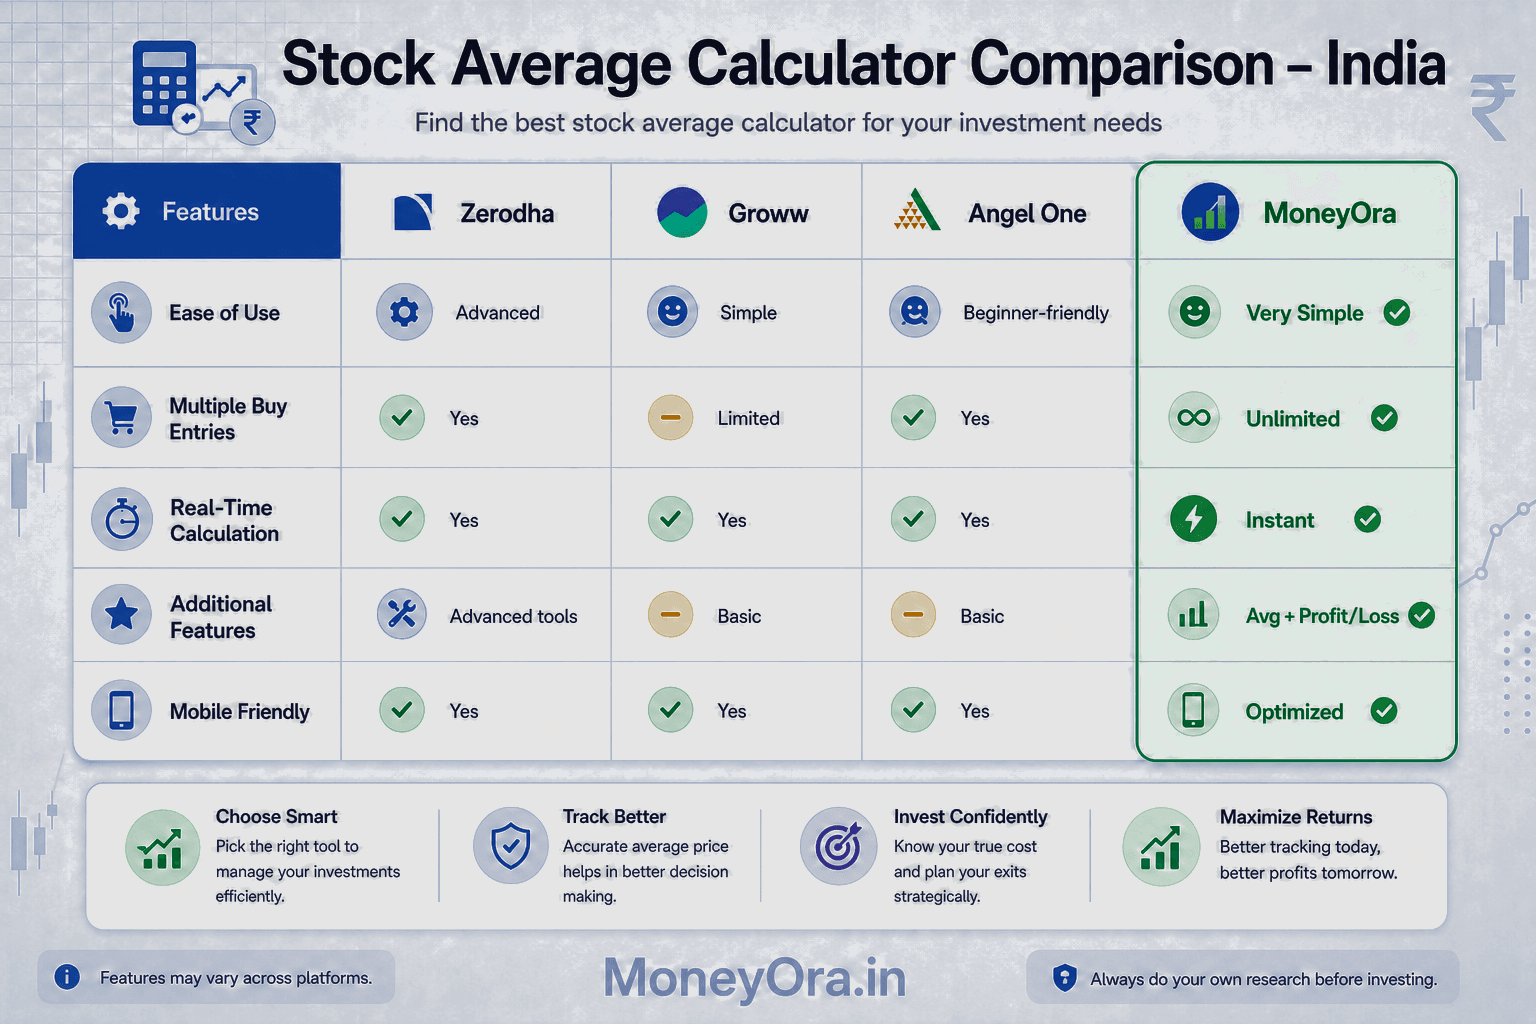
Zerodha vs Groww vs Angel One vs MoneyOra: Which Stock Average Calculator Is Better?
If you have searched for a stock average calculator Zerodha or a stock average calculator Groww style, here is what you actually get from each platform versus MoneyOra:
| Feature | Zerodha | Groww | Angel One | MoneyOra |
|---|---|---|---|---|
| Free to use | Yes | Yes | Yes | Yes |
| No login needed | No | No | No | Yes |
| Add multiple buy rows | Limited | Yes | Limited | Yes |
| Profit/loss after averaging | No | Yes | No | Yes |
| Includes brokerage in cost | In-app only | No | No | Yes (with Brokerage Calculator) |
| Works for US stocks | No | No | No | Yes |
| Linked to other tools | Partial | Partial | Partial | Full suite |
| Mobile-friendly | Yes | Yes | Yes | Yes |
The main practical difference: Zerodha, Groww, and Angel One show your average inside their own platforms — but only for stocks you already hold there. MoneyOra’s stock average calculator is standalone. You can use it to plan a trade before you place it, without being tied to any broker’s ecosystem. Combine it with the Brokerage Calculator to factor in STT and charges, and the Stop-Loss Calculator to set your exit before you enter.
When Averaging Down in Stocks Actually Makes Sense
Averaging down gets oversimplified. People either swear by it or say it is reckless. The truth is messier — it depends entirely on why the stock is falling and what you know about the company.
The RBI’s investor education resources consistently flag impulsive averaging as one of the most common retail investor mistakes. That does not mean averaging is wrong — it means the reason behind it matters.
Cases where averaging down makes sense
- The business is fine, the market is not. If a quality company’s stock drops because of a broader market selloff — NIFTY down 10%, US Fed raising rates — the fall may have nothing to do with the company itself. These corrections often reverse.
- You have actual conviction. Not “I hope it goes back up” conviction — actual research. You have read the quarterly results, you understand the business, and you believe the drop is temporary.
- Your position size stays manageable. Most experienced investors keep any single stock under 5–10% of their portfolio. Averaging is less dangerous when you are not already over-exposed.
- The valuation is genuinely cheaper. If a stock you liked at 20x earnings is now at 14x the same earnings, that is a real change. If earnings have also dropped, the “cheaper” price may be an illusion.
Cases where you probably should not average
- The company’s revenue, margins, or promoter holding has deteriorated
- You are averaging because you cannot accept being wrong
- The sector is in long-term structural decline (think: legacy telecom or certain PSU banks)
- You need this money back within 1–2 years
Risks of Averaging Down That Most Guides Skip Over
Capital gets trapped
Every rupee you pour into a falling stock is a rupee that cannot go into something that is working. This opportunity cost is invisible in your stock average calculation but very real in your portfolio returns over time.
You might be doubling down on a mistake
Sometimes stocks fall because the company is genuinely in trouble — not temporarily. A new competitor, a regulatory shift, accounting fraud, a promoter pledging shares. The price drop is information. Ignoring it and averaging anyway is a choice, not a strategy.
Sunk cost thinking
“I’ve already put ₹50,000 into this — I can’t exit now.” The ₹50,000 is gone either way. The question is whether putting in another ₹30,000 is a good decision today, based on today’s facts — not based on what you have already lost.
Margin amplifies everything
Averaging on margin while the stock keeps falling is genuinely dangerous. A stock that goes from ₹100 to ₹50 while you hold it on leverage can wipe out more than your initial investment. Check your exposure with the Margin Calculator before adding to any leveraged position.
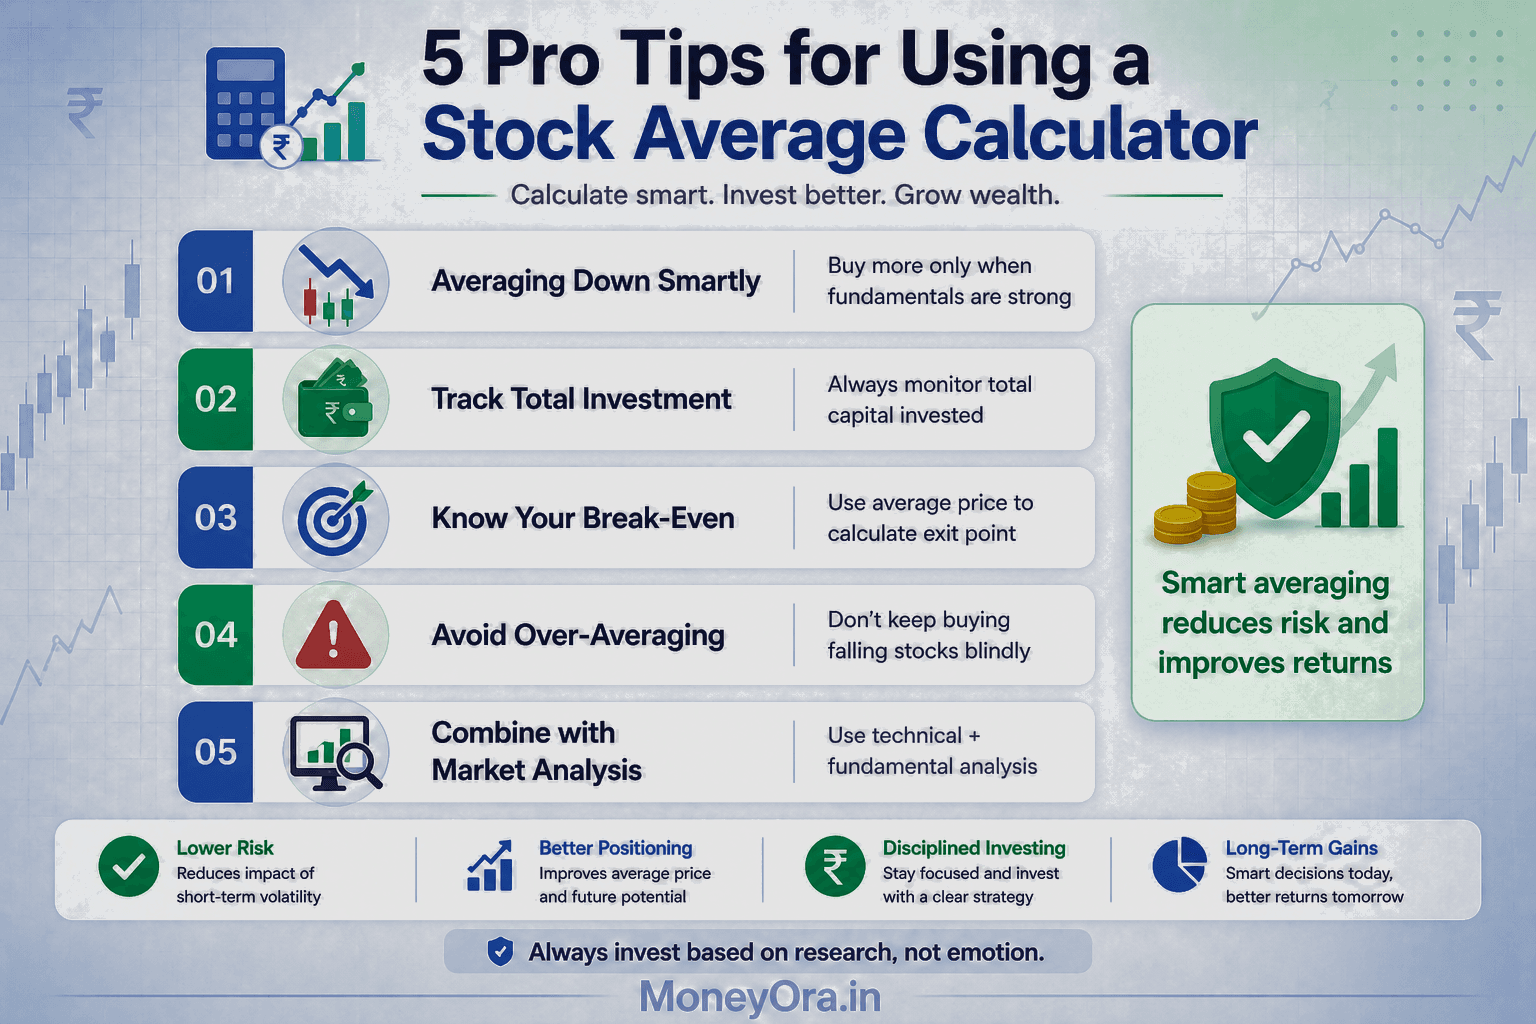
Pro Tips for Smarter Stock Averaging
The price average the calculator gives you is clean math. Your actual cost includes STT, exchange charges, and brokerage on every buy. Use the Brokerage Calculator to find your true per-share cost, then use that as your input.
Decide upfront: if this stock falls another 15% from my new average, I exit. Use the Stop-Loss Calculator to pin that number before you place the trade — not after you are emotionally invested in a larger position.
Lowering your average by ₹50 sounds good. But what does your new position actually need to do, annually, over 3–5 years to give you a decent return? Run the math on the CAGR Calculator. Sometimes the math does not support the move.
A general rule of thumb used by many traders: if you have averaged a stock three times and it is still falling, stop and reassess. The market is telling you something. Three chances to be right is plenty.
Sometimes the right move is not averaging a volatile stock but redirecting that money into an index fund via SIP. You automatically average your cost over time, across hundreds of companies, with far less single-stock risk.
Common Mistakes Investors Make with Stock Averaging
Using a simple average instead of a weighted one
Adding three buy prices and dividing by three is wrong — unless your quantities were identical each time, which they almost never are. Always use the weighted average formula. Or just use the stock average calculator and skip the debate.
Forgetting transaction costs
Brokerage, STT (Securities Transaction Tax), and GST add to your actual cost per share across every purchase. For people making 5–8 averaging trades on the same stock, this is not trivial. The Brokerage Calculator exists for exactly this reason.
Averaging stocks they do not understand
If you bought a stock because someone recommended it on a WhatsApp group, averaging it as it falls is not conviction investing — it is doubling down on someone else’s guess.
Not keeping records across transactions
If you bought a stock 6 times over 18 months across different brokers or accounts, your average calculation gets messy fast. This also matters for income tax purposes in India — the Income Tax Department requires you to report your actual cost of acquisition for capital gains, not an estimate.
Anchoring to the original buy price
“I bought at ₹500, so ₹300 is cheap.” This reasoning ignores whether ₹300 is actually a fair price for the company today. Stock prices have no memory of where you entered. They do not owe you a recovery.
Related Calculators on MoneyOra
The stock average calculator is one piece. Here are the tools that work alongside it for a more complete picture of your investments and finances.
Trading and portfolio tools
- Stock Return Calculator — Calculate actual profit or loss on your equity holdings
- Brokerage Calculator — Know your exact trading cost before you place any order
- Margin Calculator — Check your margin requirement for intraday or F&O trades
- P/E Ratio Calculator — See whether a stock is cheap or expensive relative to earnings
- Dividend Calculator — Estimate dividend income from any stock position
- Option Price Calculator — Price options for your F&O trades
- Stop-Loss Calculator — Set a clear exit before entering any trade
- Position Size Calculator — Size your positions so one bad trade does not wreck your account
Investment and wealth planning
- SIP Calculator — Plan monthly mutual fund contributions over time
- Lumpsum Calculator — Estimate growth on a one-time investment
- CAGR Calculator — Find the annualised return on any investment
- SWP Calculator — Plan systematic withdrawals from your corpus
- FD Calculator — Check Fixed Deposit maturity amounts
- RD Calculator — Plan Recurring Deposits
- PPF Calculator — Estimate your Public Provident Fund growth over 15 years
- NPS Calculator — Calculate your National Pension Scheme corpus at retirement
- EPF Calculator — Track Employee Provident Fund growth
Loan and EMI tools
- EMI Calculator — Monthly payment on any loan
- Home Loan EMI Calculator — Plan your housing loan repayment schedule
- Car Loan EMI Calculator — Check monthly car loan payments
- Personal Loan EMI Calculator — Plan personal loan repayments
Conclusion
Your average buying price is not just a number. It tells you exactly where you need the stock to go before you break even, how your overall position compares to the current market price, and whether an additional purchase changes your situation in a meaningful way.
Getting that number right matters. A stock average calculator does it in seconds — no spreadsheets, no manual multiplication, no rounding errors. Whether you are on Zerodha, Groww, Angel One, Dhan, or any other platform, the calculation is the same. What changes is where you do it.
The MoneyOra Stock Average Calculator needs no account, handles as many purchase rows as you need, and connects directly to the other tools that make stock decisions clearer — the stop-loss calculator, the position size calculator, the stock return calculator. Use them together and you move from guessing to knowing.
Frequently Asked Questions
It is a free online tool.
It calculates your weighted average purchase price.
It works across multiple buys of the same stock.
Enter price and quantity for each transaction.
The calculator divides total investment by total shares.
It gives the average cost per share.
Average Price = Total Investment ÷ Total Shares.
Total Investment is sum of (Price × Quantity).
Total Shares is sum of all quantities.
This is a weighted average calculation.
It accounts for different buy prices and quantities.
Buy more shares at a lower price.
This is called averaging down.
If your average is ₹200 and you buy at ₹160, average falls.
The more shares you buy at lower price, the more it drops.
Zerodha Kite shows average cost for current holdings.
It does not help with future planning.
For pre-trade calculation, use an external tool.
MoneyOra's calculator works without login.
Groww's calculator is inside its app.
It requires a Groww account.
MoneyOra's calculator is standalone.
No login is required.
It works for Indian and US stocks.
It also connects with other tools.
Yes, Excel can be used.
Formula is =SUMPRODUCT(price_range, qty_range)/SUM(qty_range).
Online calculators are faster.
No setup is required.
They work well on mobile.
Averaging down is buying more after price falls.
It is focused on a single stock.
Dollar-cost averaging is investing regularly.
It spreads investment over time.
DCA reduces timing risk.
Averaging down is more targeted.
Yes, brokerage increases your cost.
Other charges like STT and exchange fees also add.
Most calculators show only price average.
Use brokerage calculator for real cost.
It is risky in most cases.
Penny stocks can fall further.
Some never recover.
Your average price may drop.
But recovery is not guaranteed.
Invest only what you can afford to lose.
Yes, it supports all currencies.
You can enter USD, INR, or any currency.
It calculates weighted average automatically.
Works for NSE, BSE, NYSE, and NASDAQ.