
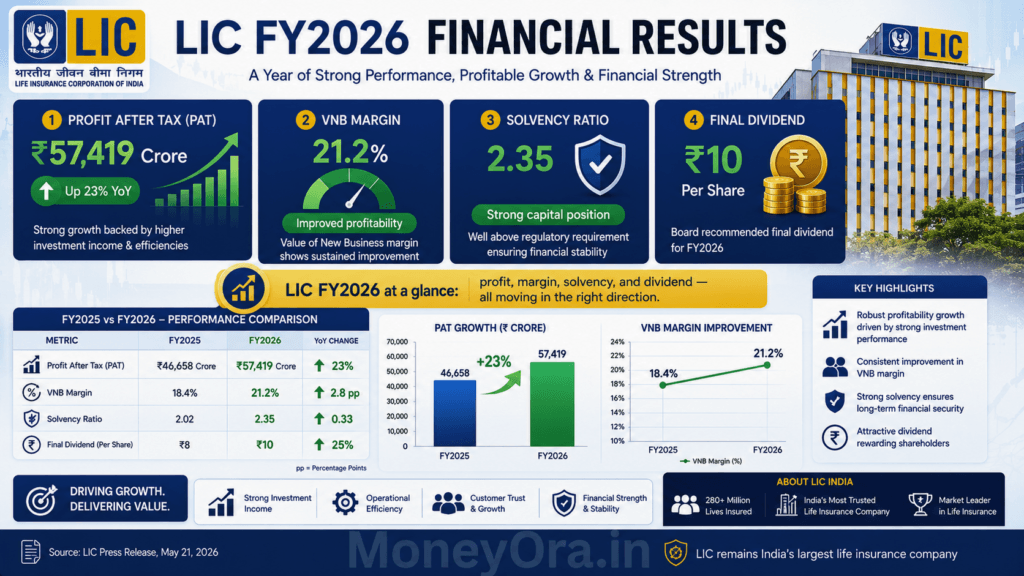

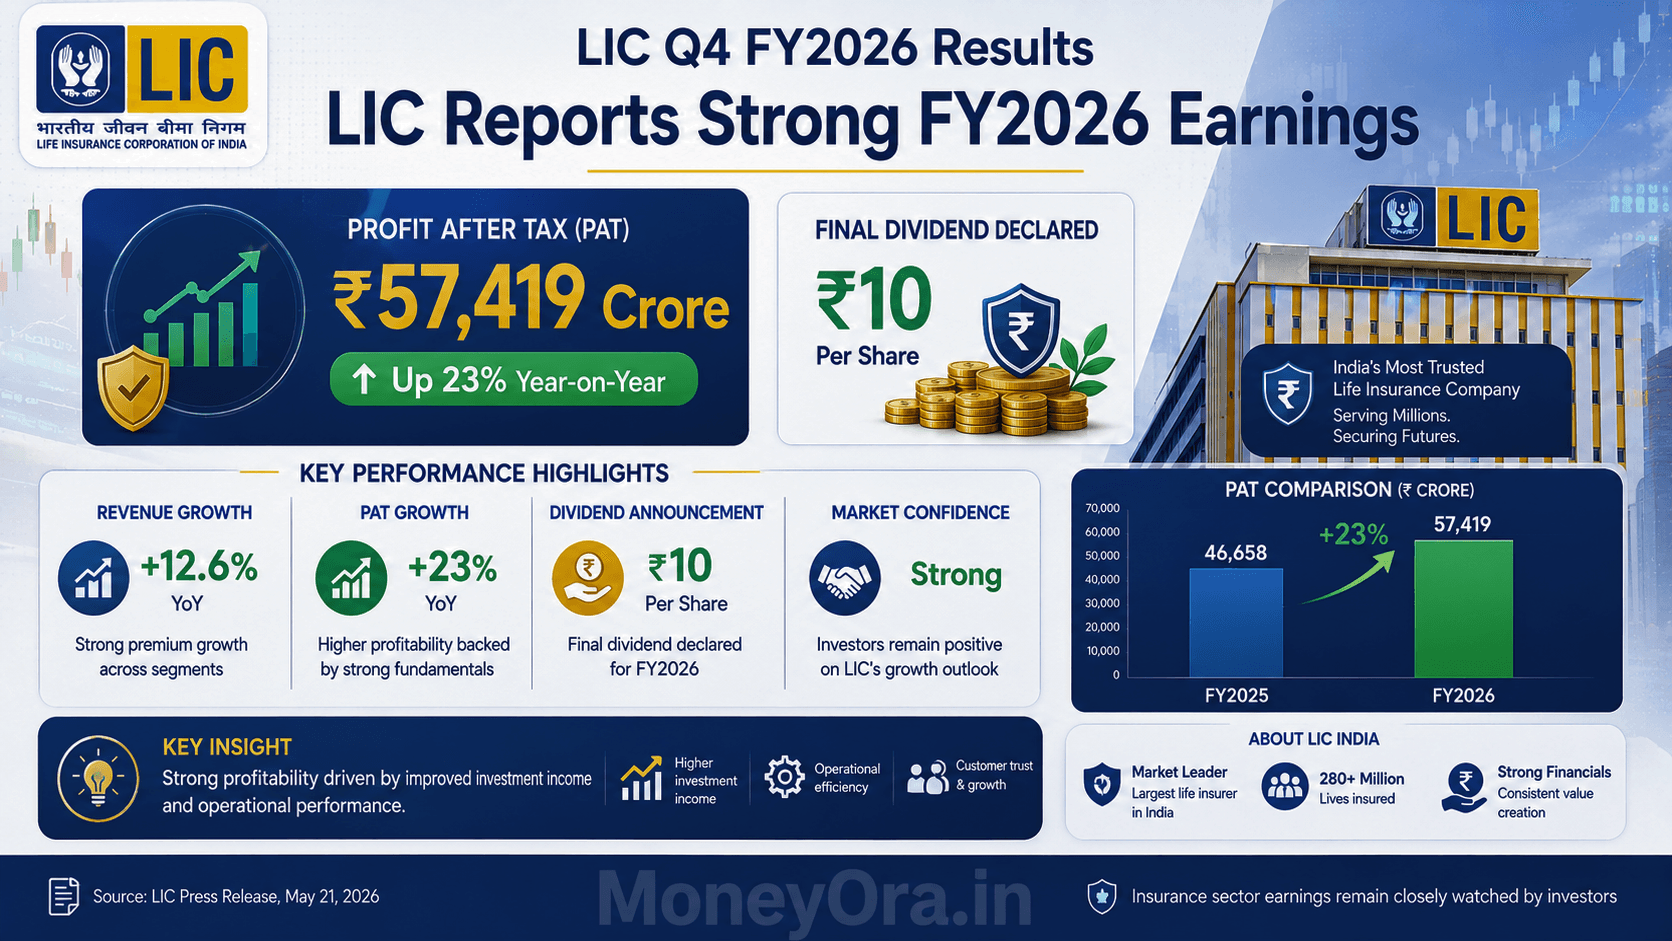
The LIC Q4 Results for FY2026 are out — and they are hard to ignore. Life Insurance Corporation of India reported a Profit After Tax of ₹57,419 crore for the full year FY2026, up 19.25% from ₹48,151 crore last year. In Q4 alone, the LIC Q4 results show consolidated net profit hitting ₹23,467 crore — a 23% jump over Q4 FY2025. “share market today: how LIC’s FY26 results fit into the broader market story”
For a company of this size, these are not routine increments. The LIC Q4 results FY2026 show meaningful progress across the metrics that actually matter: VNB margin expanded 360 basis points, the solvency ratio strengthened to 2.35, expense ratio fell by 51 bps, and the policyholder bonus came in at ₹59,726 crore. “if you prefer growth over value — explore India’s top AI stocks for 2026”
The board recommended a final dividend of ₹10 per equity share. And CEO Siddhartha Mohanty described FY2025-26 as “a satisfying year with strong overall growth across every business vertical. “India’s institutional assets — from LIC’s ₹57 lakh crore AUM to RBI’s ₹8.36 lakh crore gold reserve”
This article breaks down every number from the official press release — what it means, why it matters, and what investors and policyholders should take from it.
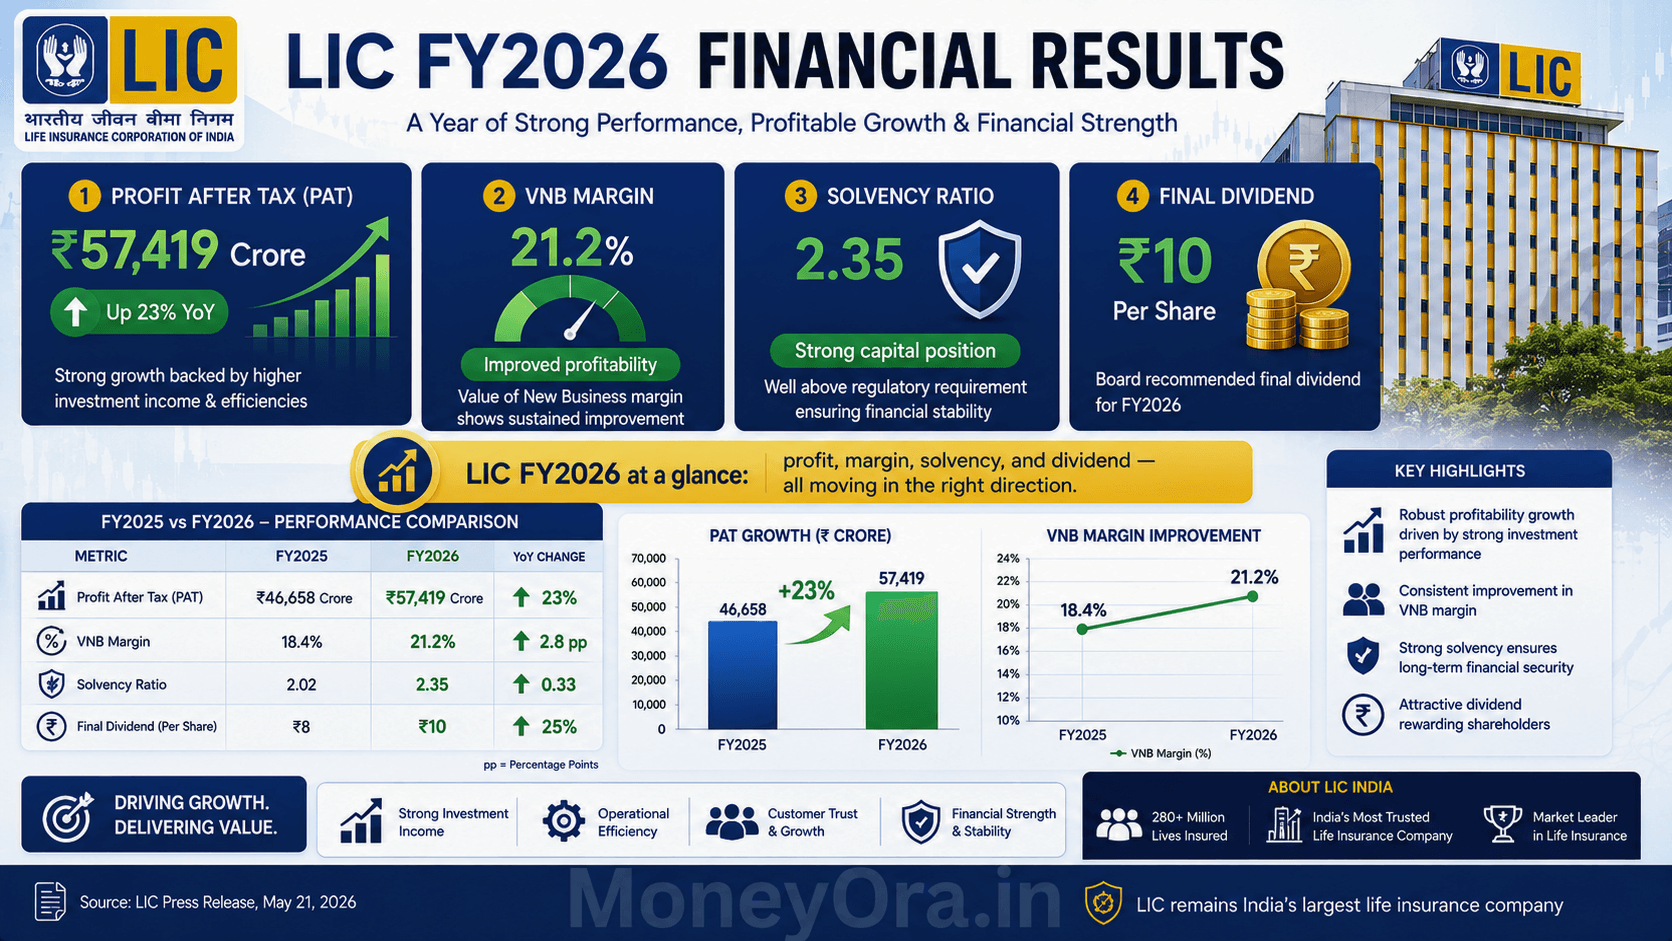
FY2026 Quick Snapshot — LIC (NSE: LICI | BSE: 543526)
- PAT (Full Year): ₹57,419 crore (+19.25% YoY)
- Q4 Consolidated Net Profit: ₹23,467 crore (+23% YoY)
- Final Dividend: ₹10 per share
- VNB (Net): ₹14,179 crore (+41.63%)
- VNB Margin (Net): 21.2% (vs 17.6% in FY25)
- Solvency Ratio: 2.35 (vs 2.11 in FY25)
- AUM: ₹57,29,396 crore (+5.08%)
- Policyholder Bonus: ₹59,726 crore
LIC Q4 Results FY2026: Full Metrics Table at a Glance
The full metrics table from LIC’s May 21, 2026 press release. All figures are in Rs crore unless stated otherwise.LIC Q4 Results
| Sr. | Metric | FY2025 (₹ Cr) | FY2026 (₹ Cr) | YoY Growth |
|---|---|---|---|---|
| 1 | Profit After Tax (PAT) | 48,151 | 57,419 | +19.25% |
| 2 | New Business Premium Income (Individual) | 62,495 | 67,676 | +8.29% |
| 3 | Renewal Premium (Individual) | 2,56,541 | 2,71,699 | +5.91% |
| 4 | Total Premium (Individual) | 3,19,036 | 3,39,375 | +6.37% |
| 5 | Total Group Business Premium | 1,69,112 | 1,96,609 | +16.26% |
| 6 | Total Premium Income | 4,88,148 | 5,35,984 | +9.80% |
| 7 | No. of Policies Sold (Individual) | 1,77,82,975 | 1,84,41,175 | +3.70% |
| 8 | Indian Embedded Value (IEV) | 7,76,876 | 7,89,185 | +1.58% |
| 9 | Value of New Business / VNB (Net) | 10,011 | 14,179 | +41.63% |
| 10 | VNB Margin (Net) | 17.6% | 21.2% | +360 bps |
| 11 | Overall Expense Ratio | 12.42% | 11.91% | −51 bps |
| 12 | Solvency Ratio | 2.11 | 2.35 | Improved |
| 13 | 13M / 61M Persistency (Premium Basis) | 74.84% / 63.12% | 74.64% / 59.31% | Mixed |
| 14 | 13M / 61M Persistency (No. of Policies) | 64.12% / 50.31% | 64.87% / 46.88% | Mixed |
| 15 | Individual Business APE | 38,218 | 43,335 | +13.39% |
| 16 | Group Business APE | 18,610 | 23,626 | +26.95% |
| 17 | Total APE (Ind + Group) | 56,828 | 66,961 | +17.83% |
| 18 | Ind APE Product Mix (Par/Non-Par incl Linked) | 72.31% / 27.69% | 64.89% / 35.11% | Mix shift |
| 19 | Assets Under Management (AUM) | 54,52,297 | 57,29,396 | +5.08% |
Source: LIC Press Release dated May 21, 2026 (Pan India). NSE: LICI | BSE: 543526.LIC Q4 Results
LIC Q4 Results: The Quarter That Closed FY2026
The LIC Q4 results for January–March 2026 made it the strongest quarter of the year. Consolidated net profit for the quarter came in at ₹23,467 crore — up 23% from ₹19,039 crore in Q4 FY2025. Net premium income for Q4 was ₹1.65 lakh crore, compared to ₹1.48 lakh crore a year ago. The full audited results are available on LIC’s official investor relations page.
Q4 FY2026 vs Q4 FY2025: Side-by-Side
| Metric | Q4 FY2026 | Q4 FY2025 | Change |
|---|---|---|---|
| Consolidated Net Profit | ₹23,467 Cr | ₹19,039 Cr | +23% |
| Net Premium Income | ₹1.65 Lakh Cr | ₹1.48 Lakh Cr | +11.5% approx |
| Solvency Ratio | 2.35 | 2.11 | Improved |
| Investment Income (Q) | ₹1.09 Lakh Cr | – | +17% YoY |
| Single Premium Collections | ₹70,119 Cr | – | +22% YoY |
What Drove Q4 Profit Growth?
Investment Income: The Big Engine
Investment income for the quarter grew 17% to reach ₹1.09 lakh crore. For an insurer of LIC’s size — managing over ₹57 lakh crore in assets — investment returns are the primary profit driver. The equity market performance in Q4 (Nifty and Sensex both posting gains) contributed to mark-to-market gains and dividend income from LIC’s extensive equity portfolio.LIC Q4 Results
Single Premium Collections
Single premium collections jumped 22% to ₹70,119 crore. This matters because single premium products typically come with lower distribution costs (no multi-year agent commissions), which directly boosts profitability per rupee of business written. The shift toward single premium also partially explains why the expense ratio fell.LIC Q4 Results
Why Q4 Is Typically LIC’s Strongest Quarter
LIC’s business has a seasonal pattern. Q4 (January–March) is the tax-saving quarter. Customers rush to buy insurance and investment products before March 31 to claim Section 80C deductions. This creates a natural spike in new premium collection every Q4. In FY2026, that seasonal tailwind was stronger than usual — partly due to aggressive push through bancassurance and digital channels.LIC Q4 Results
LIC Q4 Results — Premium Income: Individual and Group Business
Total premium income for FY2026 was ₹5,35,984 crore — up 9.80% from ₹4,88,148 crore in FY2025. That is a meaningful jump for a base this large.LIC Q4 Results
Individual Business Premium
Individual new business premium income grew 8.29% to ₹67,676 crore. Individual renewal premium — the premium collected from existing policies in force — rose 5.91% to ₹2,71,699 crore. Total individual premium (new + renewal) came in at ₹3,39,375 crore, up 6.37%.LIC Q4 Results
Policies Sold: Volume Growth
LIC sold 1,84,41,175 individual policies in FY2026, up 3.70% from 1,77,82,975 policies in FY2025. That is nearly 1.85 crore new policies in a single year. For context, India’s entire private life insurance industry combined sells fewer policies per year than LIC alone.LIC Q4 Results
Group Business Premium
Group business premium — policies covering employees and members of organisations — grew faster than individual business. Total group premium income rose 16.26% to ₹1,96,609 crore. Group business APE (Annualised Premium Equivalent) grew 26.95% to ₹23,626 crore.LIC Q4 Results
Why Group Business Growth Matters
Group business is efficient to acquire — one corporate client can cover thousands of employees. The 16.26% growth suggests LIC is gaining ground in the corporate employee benefits segment, traditionally a space where private sector insurers (SBI Life, HDFC Life, ICICI Prudential) had been more aggressive.LIC Q4 Results
Total APE: The Combined Picture
Total APE (Individual + Group) grew 17.83% to ₹66,961 crore. Individual business APE alone was up 13.39% to ₹43,335 crore. APE is the standard industry metric for measuring the underlying business volume — it normalises single premium products by dividing them by 10 to make them comparable to regular premium policies.LIC Q4 Results
VNB and VNB Margin: The Quality Shift That Matters Most
If one number in LIC’s FY2026 results deserves the most attention from investors, it is the VNB Margin (Net) at 21.2%.LIC Q4 Results
VNB — Value of New Business — measures the present value of future profits expected from new policies written in the year. The margin tells you how profitable each rupee of new business actually is. A rising VNB margin means LIC is writing better-quality, higher-margin business.LIC Q4 Results
The Numbers
- VNB (Net) FY2026: ₹14,179 crore (vs ₹10,011 crore in FY2025) — up 41.63%
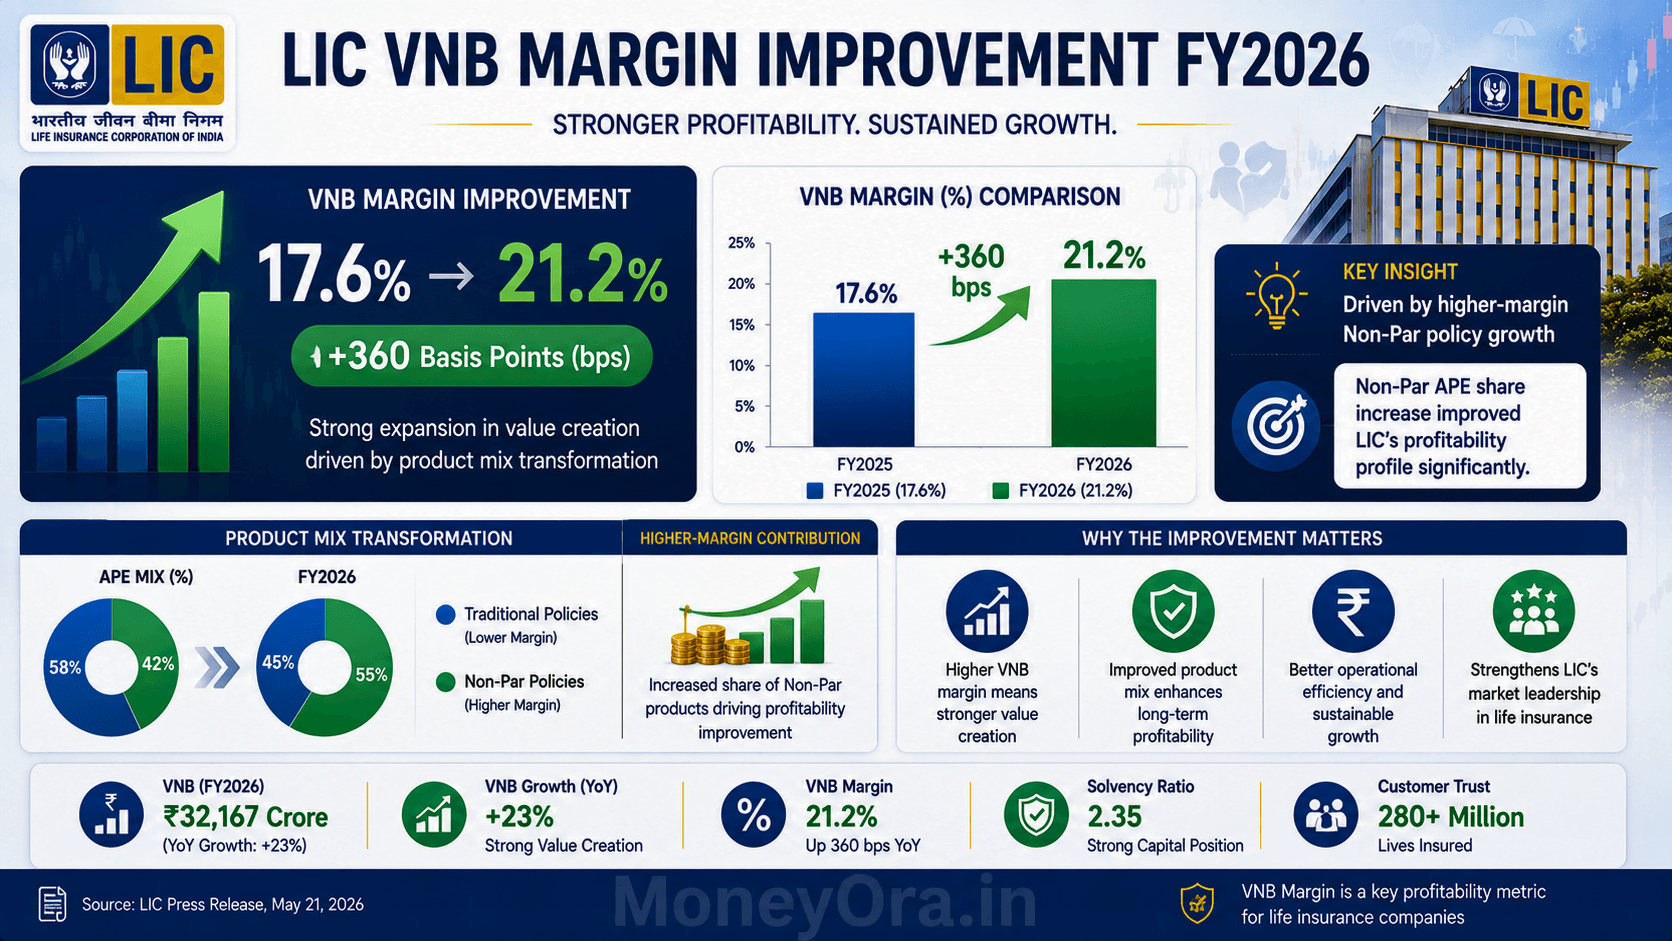
- VNB Margin (Net) FY2026: 21.2% (vs 17.6% in FY2025) — up 360 basis points
Why VNB Grew 41% When Total APE Only Grew 18%
When VNB grows nearly twice as fast as APE, it means the margin on each policy improved significantly — not just the volume. This is driven by the product mix shift: LIC sold proportionally more Non-Par (Non-Participating) products in FY2026.LIC Q4 Results
Non-Par Products vs Par Products: The Margin Difference
| Feature | Par (Participating) Products | Non-Par Products |
|---|---|---|
| Profit sharing | Customer gets bonus from profits | Fixed guaranteed returns only |
| Margin for insurer | Lower (profits shared) | Higher (no profit sharing) |
| VNB contribution | Lower per policy | Higher per policy |
| Example | LIC Jeevan Anand, traditional endowment plans | LIC Tech Term, SIIP ULIP plans, annuities |
| LIC’s FY25 mix | 72.31% of Ind APE | 27.69% of Ind APE |
| LIC’s FY26 mix | 64.89% of Ind APE | 35.11% of Ind APE |
Non-Par share in individual business jumped from 27.69% to 35.11% — a 7.42 percentage point shift in one year. That is what drove the margin expansion.LIC Q4 Results
How Does LIC’s VNB Margin Compare to Private Peers?
Private life insurers like HDFC Life and SBI Life have been operating at VNB margins of 25%–29%. LIC’s 21.2% is still below that range, but the 360 bps improvement in one year is the fastest margin expansion LIC has reported since listing. The gap with private players is closing, and that is what the market has been watching for.LIC Q4 Results
Expense Ratio and Solvency Ratio: Efficiency and Stability
Expense Ratio: Down 51 bps to 11.91%
LIC’s overall expense ratio fell from 12.42% in FY2025 to 11.91% in FY2026, a reduction of 51 basis points. This is a direct measure of operating efficiency — the lower the ratio, the less LIC spends (on commission, administration, and distribution) for every rupee of premium it earns.LIC Q4 Results
What Drove the Expense Ratio Down?
- Growth in group business (lower distribution cost per rupee of premium)
- Higher single premium collections (no recurring agent commissions)
- Increased share of bancassurance and digital channels (lower cost than traditional agent networks)
- Operational scale — premium income growing faster than fixed overhead costs
Context: How Does 11.91% Compare?
IRDAI does not prescribe a specific expense ratio limit for life insurers (unlike the expense of management limits that apply differently to general and health insurers). Among major private players, expense ratios typically run 12%–18%. LIC’s 11.91% puts it at the lean end of the industry — partly because of scale, partly because its agent-heavy model, while expensive per agent, generates an enormous absolute premium base to spread costs over.LIC Q4 Results
Solvency Ratio: 2.35 — Well Above the Regulatory Floor
LIC’s solvency ratio improved to 2.35 in FY2026 from 2.11 in FY2025. IRDAI (Insurance Regulatory and Development Authority of India) requires a minimum solvency ratio of 1.5 for all life insurers. LIC at 2.35 is 57% above the regulatory floor.LIC Q4 Results
What Does the Solvency Ratio Actually Mean?
The solvency ratio measures an insurer’s available capital against the minimum capital it is required to hold (based on its liabilities). A ratio of 2.35 means LIC holds ₹2.35 in available solvency capital for every ₹1.00 of required capital. The higher this number, the more cushion the company has against unexpected claim surges or investment losses.LIC Q4 Results
Why Policyholders Should Pay Attention to This Number
For LIC’s 200 million policyholders, the solvency ratio is not just an investor metric — it is a measure of whether the company can pay claims. At 2.35, there is no near-term concern. But it is the right number to track over time. A solvency ratio that starts declining toward 1.5 would be a warning sign worth noting.LIC Q4 Results
AUM and Indian Embedded Value: The Balance Sheet Behind the Results
AUM: ₹57,29,396 Crore — India’s Largest Institutional Investor
LIC’s Assets Under Management grew 5.08% to ₹57,29,396 crore (approximately ₹57.29 lakh crore or about $685 billion at current exchange rates). This is not just large by Indian standards — it is one of the largest pools of managed assets by any single institution in Asia.LIC Q4 Results
What Does LIC Do with ₹57 Lakh Crore?
LIC’s investment portfolio is heavily skewed toward government securities and bonds (which are low-risk and match the long-term nature of life insurance liabilities). Approximately:LIC Q4 Results
- ~75% in government securities, state development loans, and bonds
- ~20% in listed equity (making LIC one of the largest shareholders in most Nifty 50 companies)
- ~5% in real estate, infrastructure, and other assets
The 5.08% AUM growth in a year reflects both new premium inflows and investment returns on the existing corpus. For policyholders with participating (bonus-linked) policies, AUM growth is directly relevant — it is the pool from which future bonuses are declared.LIC Q4 Results
Indian Embedded Value (IEV): ₹7,89,185 Crore
Indian Embedded Value (IEV) grew 1.58% to ₹7,89,185 crore from ₹7,76,876 crore in FY2025. IEV is an actuarial estimate of the present value of future profits already locked in from existing policies — plus the net worth of the company. It is the closest thing to a “fair value” floor for the company.LIC Q4 Results
IEV Per Share
LIC has approximately 632.50 crore shares outstanding (post-bonus issue adjustment). At ₹7,89,185 crore IEV, the IEV per share works out to approximately ₹1,248 per share. Investors and analysts use this as a key valuation anchor — where LIC’s stock trades relative to its embedded value per share is a standard insurance sector valuation metric.LIC Q4 Results
Why IEV Grew Only 1.58% When Profit Grew 19%?
IEV growth lagging profit growth is common for insurance companies. IEV is a long-term actuarial number that moves slowly by design. Large short-term profits (like the Q4 spike in investment returns) do not necessarily flow through to IEV immediately — IEV is based on expected long-term returns, not mark-to-market quarterly swings. The 1.58% IEV growth is consistent with the nature of the metric.LIC Q4 Results
Non-Par APE and Product Mix Shift: The Story Behind the Margins
This is the structural story of FY2026 — and arguably the most important one for long-term LIC investors.LIC Q4 Results
Individual Business Non-Par APE: Up 43.78% to ₹15,214 Crore
Non-Par APE grew nearly twice as fast as total individual business APE (43.78% vs 13.39%). Non-Par products’ share within individual business jumped from 27.69% in FY2025 to 35.11% in FY2026.LIC Q4 Results
Why This Is a Big Deal
LIC was historically known as a “Par-heavy” insurer — the vast majority of its business was traditional participating plans that shared profits with policyholders through bonuses. This is great for policyholders, but it limits the amount of profit the insurer itself can retain. Private insurers built their advantage by selling proportionally more Non-Par products (term plans, annuities, ULIPs) that carry higher margins for the insurer.LIC Q4 Results
LIC’s FY2026 results show it is catching up — fast. If Non-Par share continues growing at this pace, VNB margin could reach 24%–26% within two to three years, putting LIC closer to HDFC Life’s territory.LIC Q4 Results
Product Mix: Par vs Non-Par APE Shift
| Year | Par Share (Ind APE) | Non-Par Share (Ind APE) |
|---|---|---|
| FY2025 | 72.31% | 27.69% |
| FY2026 | 64.89% | 35.11% |
| Change | −7.42 pp | +7.42 pp |
What Drove Non-Par Growth?
Bancassurance Push
LIC’s bancassurance channel grew strongly in FY2026. Banks are more effective at distributing Non-Par products (especially annuities and term plans) than traditional LIC agents, who tend to default to familiar participating endowment plans. The bancassurance and alternate channel share of new business premium hit 7.51% in FY2026 vs 5.59% in FY2025 — small in absolute terms but growing meaningfully.LIC Q4 Results
SIIP and ULIP Products
Unit-Linked Insurance Plans (ULIPs) count as Non-Par Linked products. With equity markets performing well in the first half of FY2026, demand for market-linked insurance products increased. LIC’s SIIP (Systematic Investment Insurance Plan) saw good traction.LIC Q4 Results
Persistency Ratios: Reading the Policyholder Retention Numbers
Persistency is one of the more nuanced metrics in insurance results. It measures what percentage of policies are still active (premiums still being paid) after a certain number of months.LIC Q4 Results
What the Numbers Say
| Metric | FY2025 | FY2026 | Change |
|---|---|---|---|
| 13M Persistency (Premium Basis) | 74.84% | 74.64% | −0.20 pp |
| 61M Persistency (Premium Basis) | 63.12% | 59.31% | −3.81 pp |
| 13M Persistency (No. of Policies) | 64.12% | 64.87% | +0.75 pp |
| 61M Persistency (No. of Policies) | 50.31% | 46.88% | −3.43 pp |
The Mixed Picture on Retention
The 13-month persistency (which measures whether a policy is still active one year after purchase) held steady — a positive sign. The 61-month persistency (five-year retention) declined, particularly on the premium basis. This is the one area in FY2026 results where LIC did not move forward.LIC Q4 Results
Why 61M Persistency Declined
A drop in 61M persistency often reflects the policy vintage cohort being measured — policies from five years ago (FY2021 cohort) may have been sold during COVID restrictions, possibly with less thorough customer education. There may also be a mix effect: as LIC writes more Non-Par and market-linked policies (which customers sometimes lapse if returns are disappointing), the overall 61M rate can drift lower even while 13M rates hold.LIC Q4 Results
Why This Matters for LIC Shareholders
Low persistency hurts profitability. When a policy lapses, LIC has already paid the distribution cost (agent commission, sales expenses) but does not collect future premiums to amortize that cost. Improving 61M persistency from ~59% toward 65%+ would meaningfully add to LIC’s profitability without requiring any new business growth. This is one area management will likely focus on in FY2027.LIC Q4 Results
Dividend Announcement: ₹10 Per Share for FY2026
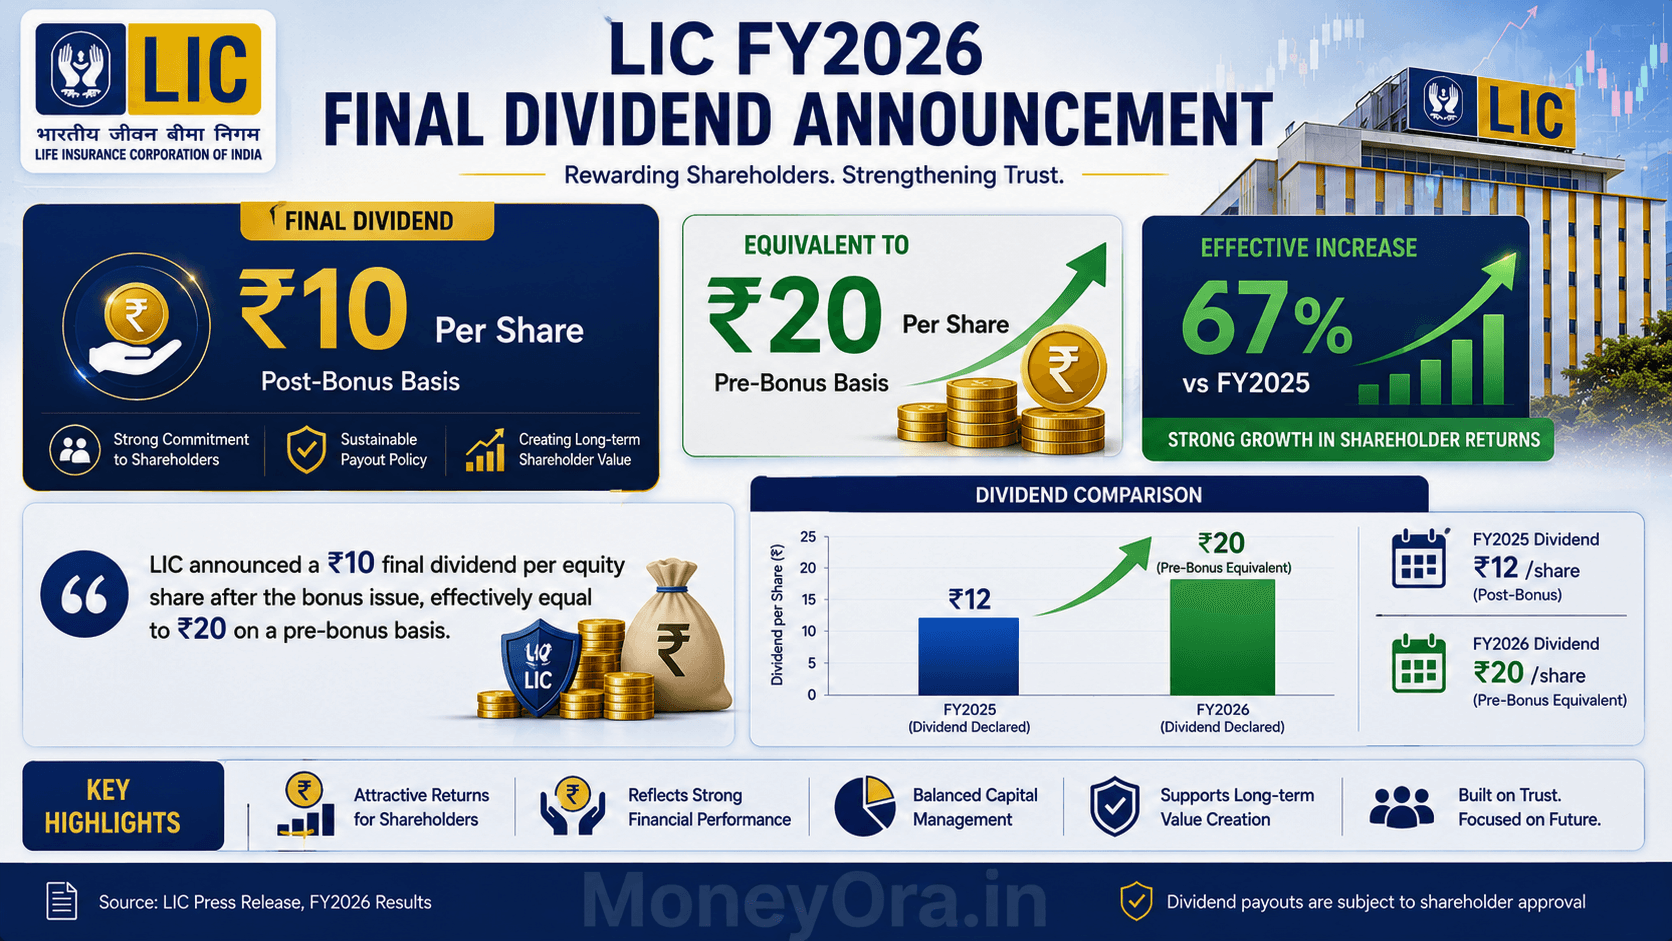
LIC’s board recommended a final dividend of ₹10 per equity share of ₹10 face value each for FY2026. On a pre-bonus issue basis, this is equivalent to ₹20 per equity share.LIC Q4 Results
Dividend Comparison: FY2025 vs FY2026
| Year | Dividend Per Share | Pre-Bonus Equivalent | PAT (₹ Cr) |
|---|---|---|---|
| FY2025 | ₹12 per share (Q4) | – | 48,151 |
| FY2026 | ₹10 per share | ₹20 per share (pre-bonus) | 57,419 |
Why ₹10 When Last Year Was ₹12?
The apparent reduction from ₹12 to ₹10 is due to the bonus share issue. LIC completed a 1:1 bonus issue (one new share for every share held), effectively doubling the number of shares in the market. After the bonus, each pre-bonus share became two shares. So the ₹20 pre-bonus equivalent per share in FY2026 vs ₹12 in FY2025 actually represents a 67% increase on a like-for-like basis.LIC Q4 Results
Total Dividend Outflow
With approximately 632.50 crore shares outstanding (post-bonus), a ₹10 per share dividend represents a total outflow of roughly ₹6,325 crore to shareholders. The government of India, which holds approximately 96.5% of LIC, receives the bulk of this dividend — making it a meaningful source of non-tax revenue for the central government.LIC Q4 Results
To calculate what your dividend income means for your overall portfolio return, use our dividend calculator. For evaluating LIC’s stock price against its earnings and valuation, the PE ratio calculator and stock return calculator give you useful reference points.
Bancassurance and Alternate Channels: LIC’s Distribution Diversification
LIC’s traditional distribution backbone is its agent force — the largest in the world for any single insurance company, with over 13 lakh active agents. But FY2026 results show the company is deliberately broadening beyond that network.
Channel Share Growth
| Channel | FY2025 Share | FY2026 Share | Change |
|---|---|---|---|
| Bancassurance and Alternate Channels | 5.59% | 7.51% | +192 bps |
| Traditional Agent Channel (implied) | ~94.41% | ~92.49% | Slight reduction |
What Bancassurance Means for LIC’s Future
Bancassurance is not just about distribution — it is about reaching customers who would never approach a traditional LIC agent. Bank customers tend to be more financially literate, more likely to buy Non-Par products, and more likely to maintain policy payments (better persistency). Growing this channel to 10%+ of new business premium would structurally improve both the product mix and the expense ratio.
Which Banks Is LIC Working With?
LIC has bancassurance tie-ups with several public sector banks including Bank of Baroda, Canara Bank, and others. In FY2026, the CEO specifically called out BAC (Bancassurance and Alternate Channels) growth exceeding ₹5,000 crore in premium — one of the benchmarks flagged in the press release as evidence of channel diversification progress.
Policyholder Bonus: ₹59,726 Crore
LIC announced a policyholder bonus of ₹59,726 crore for FY2026. This is the amount added to the corpus of participating (Par) policyholders — people with traditional endowment, money-back, and whole life policies that carry a “with profits” feature.
Who Gets This Bonus?
Only policyholders with participating policies get a share of this bonus. If you hold an LIC plan that says “with profits” or “par” on the policy document, your accumulated bonus will increase. The actual amount per policy depends on the policy type, sum assured, policy year, and the reversionary bonus rates LIC declares for each plan.
How Does ₹59,726 Crore Compare to Previous Years?
LIC’s policyholder bonus payout has been growing each year as its AUM and investment income have grown. At ₹59,726 crore, FY2026’s bonus is among the largest LIC has ever declared. For policyholders with long-standing plans (20+ years), the accumulated bonus over the policy term can sometimes exceed the basic sum assured itself.
Bonus vs Shareholder Dividend: The Split
LIC is required under the Insurance Act to distribute at least 90% of the surplus from participating business back to policyholders (the “90:10 rule” for par funds). Shareholders get 10% of par fund surplus plus 100% of Non-Par fund surplus. As Non-Par business grows, a larger share of surplus flows directly to shareholders — another structural reason the VNB margin expansion matters so much.
LIC Q4 Results FY2026: What They Mean for Investors
Numbers are one thing. What you do with them is another. Here is a clear-eyed reading of what FY2026 results tell us about LIC as an investment.
The Bull Case: Three Things Working
1. VNB Margin on a Structural Uptrend
Going from 13% to 17.6% to 21.2% in three years is not a one-off. It reflects deliberate product mix engineering. If Non-Par share reaches 45% by FY2028, VNB margin could approach 24%–25%. At that level, LIC would be priced by markets more like a quality insurance company and less like a government utility.
2. Group Business Growing Faster Than Individual
Group APE grew 26.95% vs individual APE’s 13.39%. Group business is cheaper to acquire and tends to have more stable retention. Growing this segment structurally lowers LIC’s overall expense ratio over time.
3. Solvency Headroom Is Strong
At 2.35, LIC has room to both grow aggressively and return capital to shareholders without hitting regulatory limits. For a company of this size, that buffer is genuinely meaningful.
The Risks: Two Things to Watch
1. 61-Month Persistency Is Declining
The five-year retention rate fell from 63.12% to 59.31% on a premium basis. If this continues, it will eventually show up in renewals and profitability. Retention needs to improve to justify the business volume growth story.
2. Equity Market Dependence
With ~20% of its ₹57 lakh crore AUM in equities, LIC’s investment income is sensitive to Indian equity market performance. A sharp market correction would reduce investment income and drag on quarterly profits — as happened in FY2023.
Valuation Context
At around 1.0–1.2x Price-to-Embedded Value (P/EV) — where LICI traded in early 2026 — LIC is priced below HDFC Life (3.0–3.5x P/EV) and SBI Life (2.5–3.0x P/EV). The discount reflects LIC’s lower historical VNB margins and government ownership. If VNB margin continues to expand, the valuation gap with private peers could narrow, creating re-rating potential.
Use our stock average calculator to manage your LIC holding cost if you have been accumulating the stock across price points, and the stop loss calculator to define your downside before adding to a position. For broader portfolio position sizing, the position size calculator is useful. Long-term investors can also track LIC’s compounded return using our CAGR calculator.
Related Financial Calculators on MoneyOra
Tracking corporate results is one part of investing. These tools help you act on what you have learned.
Stock Market Tools
- Dividend Calculator — Calculate dividend income from your LIC shareholding at ₹10 per share
- PE Ratio Calculator — Evaluate LIC’s earnings multiple vs private insurance peers
- Stock Return Calculator — Track LIC stock returns from your purchase date
- Stock Average Calculator — Average your LIC purchase cost across SIP-style equity buying
- Brokerage Calculator — Calculate transaction costs on LIC share trades
- Margin Calculator — Leverage for short-term LIC futures/options trading
- Option Price Calculator — LICI options pricing post-results
- Position Size Calculator — Risk-based position sizing for LIC equity holdings
- Stop Loss Calculator — Set downside protection on your LIC position
- CAGR Calculator — Compute LIC’s annualized return since your buy date
Insurance and Retirement Planning
- NPS Calculator — Model retirement corpus alongside your LIC policy value
- EPF Calculator — Total retirement savings across EPF and insurance
- PPF Calculator — Tax-free savings alongside LIC policy maturity planning
- FD Calculator — Compare guaranteed FD returns with LIC policy returns
- SIP Calculator — Monthly SIP in equity funds vs LIC premium commitment
- SWP Calculator — Post-maturity systematic withdrawal from your investment corpus
- Lumpsum Calculator — Grow your LIC bonus or dividend reinvestment over time
- RD Calculator — Compare recurring deposit returns with insurance premium savings
Loan and Banking Tools
- EMI Calculator — Calculate loan repayment if using an LIC policy surrender value for a loan
- Home Loan EMI Calculator — LIC Housing Finance loan repayment planning
- Personal Loan EMI Calculator — For loans against LIC policies
- Car Loan EMI Calculator — Vehicle finance planning
- IFSC Code Finder — Look up LIC or any bank branch IFSC for premium payments
- Bank Details Finder — Verify bank details before transferring premium payments
Conclusion: LIC FY2026 — The Direction Is Clear
Profit up 19%. Q4 profit up 23%. VNB margin at 21.2% — best ever. Solvency ratio strengthening. Expense ratio falling. Policyholder bonus at ₹59,726 crore.
These are not ambiguous numbers.
The structural story is the VNB margin.
LIC has been closing the quality gap with private peers for three years straight.
Non-Par share hit 35% in FY2026.
If it reaches 45% by FY2028, LIC will look very different to institutional investors who have historically underweighted the stock relative to HDFC Life and SBI Life.
The one area that needs watching: 61-month persistency fell again. If customers are not staying long enough for LIC to earn back its distribution costs, that eventually shows up in margins. Management knows this — it is likely a priority in FY2027.
For policyholders: ₹59,726 crore in bonus, solvency at 2.35, AUM at ₹57 lakh crore. The money is there.
For investors: the re-rating story is intact. It is just not fast.
Track LIC and Plan Your Portfolio
Use MoneyOra’s Dividend Calculator to see what your LIC dividend income works out to, the Stock Return Calculator to track your LICI holding’s performance, and the PE Ratio Calculator to benchmark LIC’s valuation against peers.
Frequently Asked Questions — LIC Q4 FY2026 Results
LIC reported PAT of ₹57,419 crore for FY2026.
Profit increased 19.25% year-on-year.
FY2025 PAT stood at ₹48,151 crore.
Q4 FY2026 consolidated net profit was ₹23,467 crore.
Q4 profit rose 23% compared to Q4 FY2025.
LIC announced final dividend of ₹10 per share.
Face value of each share is ₹10.
On pre-bonus basis, dividend equals ₹20 per share.
FY2025 dividend was ₹12 per share.
Pre-bonus adjusted dividend increased around 67%.
LIC's VNB margin improved to 21.2%.
FY2025 VNB margin was 17.6%.
Improvement was 360 basis points.
VNB grew 41.63% to ₹14,179 crore.
Growth came from higher Non-Par product share.
LIC's total AUM reached ₹57,29,396 crore.
This equals around ₹57.29 lakh crore.
AUM increased 5.08% year-on-year.
LIC remains India's largest institutional investor.
LIC's solvency ratio improved to 2.35.
FY2025 solvency ratio was 2.11.
IRDAI minimum requirement is 1.5.
LIC holds significantly higher capital than required.
This reflects strong financial stability.
LIC holds around 56.66% market share.
It remains the dominant life insurer in India.
LIC serves nearly 200 million policyholders.
This is larger than populations of many countries.
LIC declared bonus of ₹59,726 crore.
The bonus applies to participating policies.
It increases policyholder corpus value.
This is among the largest bonuses declared globally.
LIC trades on NSE under symbol LICI.
BSE code is 543526.
Results were announced on May 21, 2026.
The results covered FY ended March 31, 2026.


Pingback: Netweb Technologies Share Price Target 2026: Next AI Multibagger Stock? - MoneyOra
Pingback: AI Stocks Picks 2026: Next 5 Best Multibagger AI Stocks
Pingback: Share Market Today: Will Nifty & Sensex Continue Their Bull Run This Week? - MoneyOra
Pingback: Defence Index 2026: Top Investment Opportunity or Overvalued Risk for Investors?