
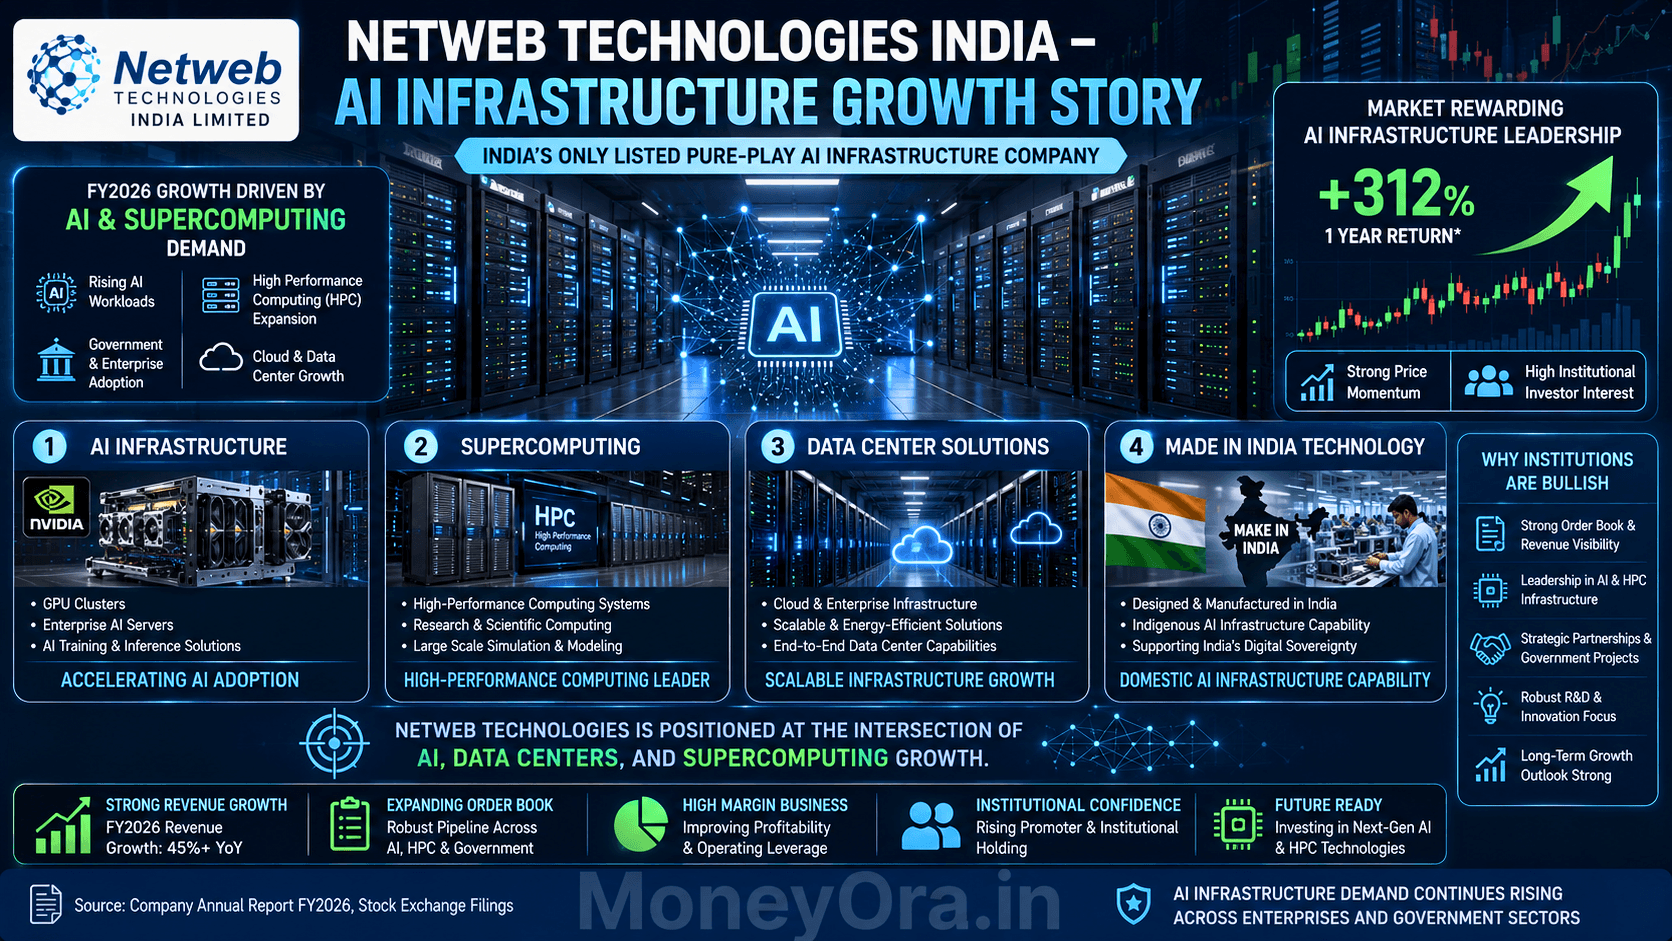
Netweb Technologies India is having a moment that very few Indian tech stocks can claim. The share price is at ₹4,521 — up 11% in a single session today (May 29, 2026) and up over 186% in the past year. Revenue jumped 90% in FY26. The AI segment grew 459%. The company is debt-free. And it just got its credit rating upgraded to CRISIL A (Stable). “Netweb is the AI server supplier inside India’s top data center stocks”
But what actually is Netweb Technologies India? Why are global institutions like GIC, Aberdeen, and BofA Securities meeting with management? And what does the FY27 guidance look like after the IndiaAI Mission’s first delivery tranche supercharged Q4 FY26 to ₹774 crore — nearly a third of the full year’s revenue in one quarter?
This article pulls every number from the latest Screener.in data, Groww’s live feed, and FY26 audited results (reported May 2, 2026) to give you a complete, current picture of Netweb Technologies India — what the company does, why the stock has exploded, the risks, and where it might go next. “see our full list of top 5 multibagger AI stocks in India for 2026”
Netweb Technologies India — Live Snapshot (May 29, 2026)
- Price (NSE):₹4,521.30 ▲ 11.03% today
- Market Cap:₹23,175 Crore
- Today’s Range:₹4,050.20 – ₹4,575.00
- 52-Week Range:₹1,700.10 – ₹4,575.00
- PE Ratio (TTM):112.59x | Industry PE:67.71x
- EPS (TTM):₹36.15 | P/B Ratio:32.04x
- Book Value:₹127.03 | ROE:28.46%
- Debt/Equity:0.39 (near zero-debt) | Dividend Yield:0.06%
- FY26 Revenue:₹2,184 Cr (+90% YoY) | FY26 PAT:₹206 Cr (+81% YoY)
- Order Pipeline:₹4,431 Cr | Confirmed Orders:₹1,625 Cr
- Technical Signal:Strongly Bullish — 12 Bullish / 1 Bearish indicators
What Is Netweb Technologies India? India’s Sovereign AI Infrastructure Play
Netweb Technologies India (NSE: NETWEB) was incorporated in 1999 and listed in 2023. Based in Faridabad, Haryana, it is the only listed, pure-play high-end computing solutions (HCS) company in India. What makes this company genuinely different from any other IT stock in the country is what it builds. “Netweb is the AI server supplier inside India’s top data center stocks — and the same AI electricity demand is why solar power companies are seeing record institutional buying”
Netweb does not write software. It does not manage IT services. It designs and manufactures complete computing systems — from scratch, in India — for the most demanding workloads on earth: AI training clusters, supercomputers, nuclear research systems, defence computing, and enterprise private clouds.
Netweb Technologies India’s Four Core Product Lines
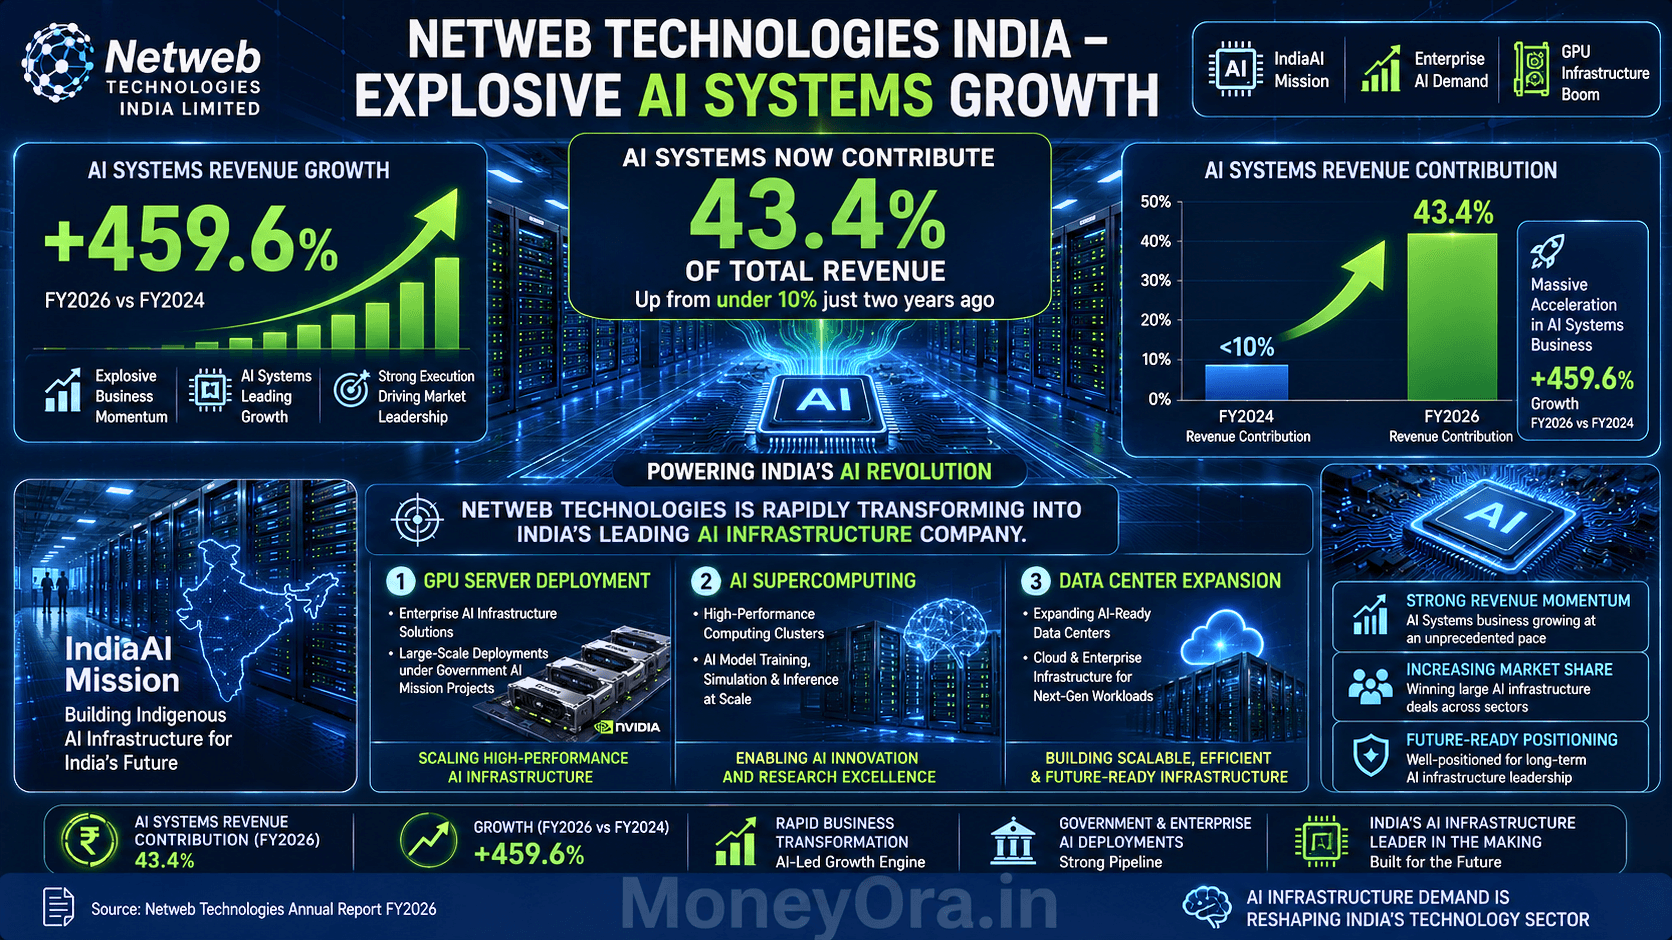
1. AI Systems (43.4% of FY26 Revenue — Up 459% YoY)
GPU-based servers for artificial intelligence training and inference. Netweb integrates NVIDIA GPUs, AMD components, high-speed interconnects, liquid cooling systems, and its own hardware design into complete, rack-level AI systems. It doesn’t just sell GPUs — it engineers the full system. This is what the IndiaAI Mission ordered. This is the fastest-growing segment by a significant distance.
2. High-Performance Computing / Supercomputing (HPC)
Netweb’s supercomputers have appeared 15 times across three entries in the Top 500 Supercomputers global ranking — the definitive benchmark list for the world’s most powerful machines. Clients include IITs, national labs, DRDO, and central government research institutions. Over 600 HPC systems installed.
3. Private Cloud and HCI (Hyper-Converged Infrastructure)
On-premise enterprise cloud solutions for large corporations and PSUs that cannot or choose not to use public cloud infrastructure. Over 7,000 AI system installations and growing private cloud footprint.
4. Data Centre Servers and HPS Solutions
High-performance storage servers, rack servers, and blade systems for large-scale data centre deployments in banks, telecom companies, and government digital infrastructure projects.
Why Netweb Technologies India Is Unique
End-to-end design and manufacturing is the moat. Netweb’s R&D team designs printed circuit boards, chassis, cooling systems, and the full hardware stack. It is not an assembler or reseller. This aligns perfectly with India’s Make in India and IndiaAI Mission programmes, which require domestic manufacturing for government procurement. No other listed Indian company can deliver what Netweb delivers at scale. “check today’s share market overview while tracking Netweb’s performance”
The IndiaAI Mission, launched by the Government of India, aims to build 10,000+ GPU-equivalent sovereign compute capacity within India. Netweb Technologies India is the primary domestic manufacturer capable of executing this vision.
Netweb Technologies India Share Price Chart & Historical Trend
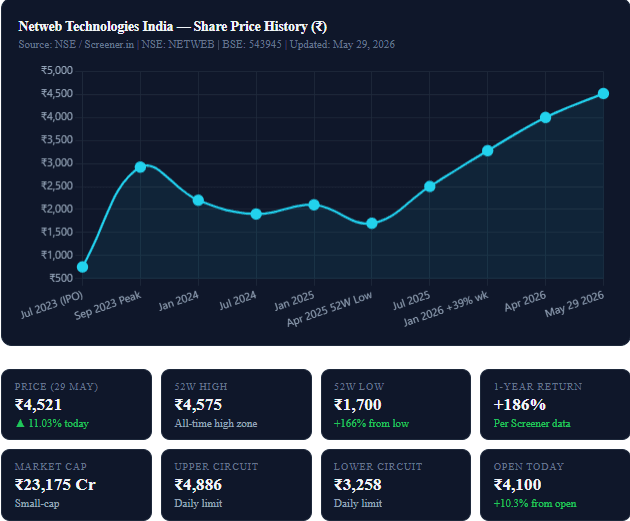
The Netweb Technologies India share price has had one of the most dramatic runs of any Indian tech small-cap since its IPO. From its listing lows near ₹500–₹600 to today’s ₹4,521, the stock has delivered a 186%+ return in the past year alone and a 3-year CAGR of approximately 42%.

Key Price Milestones for Netweb Technologies India
Netweb Technologies India — Share Price Milestone History| Event / Period | Approx. Price (₹) | Key Driver |
|---|
| IPO Listing (Jul 2023) | ~₹600–₹800 | Listed at premium; AI hype beginning |
| Post-IPO Peak (Sep 2023) | ~₹2,920 | Q4 FY24 strong results; AI theme strong |
| 52-Week Low (May 2025) | ₹1,700 | Sector rotation; Q1 FY26 soft quarter |
| IndiaAI Mission Order Win | ₹2,500–₹3,000 | ₹1,734 Cr AI server deal announced |
| Q3 FY26 Results (Jan 2026) | ₹3,079–₹3,278 | Revenue 143% YoY; EPS ₹12.94; stock +39% in 1 week |
| CRISIL A Upgrade (Apr 2026) | ~₹3,850–₹4,000 | Credit upgrade; bank facilities up to ₹700 Cr |
| FY26 Full Results (May 2, 2026) | ₹3,800–₹4,200 | 90% revenue growth, 459% AI segment growth confirmed |
| Today (May 29, 2026) | ₹4,521 | Nvidia strong Q1 results; institutional buying surge |
Netweb Technologies India — Market Depth & Today’s Trading Data
The market depth for Netweb Technologies India shows strong sell-side pressure today — 59.78% sell orders vs 40.22% buy orders — which is normal for a stock that has just gapped up 11% on the day. The ask side is heavily stacked above ₹4,522, suggesting the stock is near a key resistance zone after touching the 52-week high of ₹4,575.
Live Market Depth — NETWEB (May 29, 2026)| Bid Price (₹) | Qty | Ask Price (₹) | Qty |
|---|
| 4,520.00 | 16 | 4,521.70 | 32 |
| 4,519.10 | 18 | 4,521.80 | 12 |
| 4,519.00 | 1,025 | 4,521.90 | 39 |
| 4,518.20 | 1 | 4,522.00 | 273 |
| 4,518.10 | 18 | 4,522.50 | 13 |
| Bid Total | 1,37,375 | Ask Total | 2,04,209 |
Delivery Volume Analysis — Last 5 Days
- Total Traded Volume (5 days): 61,72,566 shares
- Delivery Volume (5 days): 15,90,237 shares
- Delivery Percentage: 25.76%
- Insight: Highest delivery percentage in 5 days — signalling strong investor participation, not just speculative trading. Delivery percentage is well above the 5-day average, showing unusually high institutional and long-term investor activity.
What High Delivery Volume Means
When delivery volume is high relative to total traded volume, it tells you investors are actually holding shares overnight — not just day trading for intraday profit. A 25.76% delivery percentage alongside a strong upward move is a positive signal. It suggests conviction buying, not momentum chasing. This kind of data is especially useful when you are deciding your own position size — something our position size calculator can help you model based on your total portfolio risk.
Netweb Technologies India FY26 Full-Year Results: The 90% Revenue Jump
The board of Netweb Technologies India approved the FY26 audited results on May 2, 2026. The headline numbers beat most sell-side estimates and confirmed the company’s status as India’s fastest-growing high-end computing firm.
FY26 Full-Year Financial Summary
Netweb Technologies India — FY26 vs FY25 Full-Year Comparison| Metric | FY25 | FY26 | YoY Growth |
|---|
| Revenue from Operations | ₹1,149 Cr | ₹2,184 Cr | +90% |
| Adjusted Operating EBITDA | ₹159 Cr | ₹290 Cr | +82.4% |
| EBITDA Margin | 13.8% | 13.3% | −50 bps |
| Profit After Tax (PAT) | ₹114 Cr | ₹206 Cr | +80.9% |
| PAT Margin | 9.9% | 9.3% | −60 bps |
| ROCE | 32.4% | 37.5% | +510 bps |
| ROE | 23.9% | 32.9% | +900 bps |
| EPS (₹) | ₹20.21 | ₹36.30 | +79.6% |
| Net Cash (Debt-Free) | Net neutral | ₹83.3 Cr net free cash | Zero net debt |
| Order Book (confirmed) | – | ₹1,625 Cr | New high |
| Total Pipeline | – | ₹4,431 Cr | Record pipeline |
Q4 FY26: The Blockbuster Quarter
Q4 FY26 (January–March 2026) was the single most important quarter in Netweb’s listed history. Revenue jumped to ₹774 crore — up 86.6% YoY and representing 35% of the entire FY26 revenue in one quarter. This concentration came from the IndiaAI Mission Tranche-1 deliveries — a massive AI server deployment for the Government of India’s sovereign compute programme.
- Q4 FY26 Revenue: ₹774 crore (+86.6% YoY)
- Q4 FY26 EBITDA: ₹97 crore (+63% YoY); margin 12.5% (compressed from hardware-heavy mix)
- Q4 FY26 PAT: ₹71 crore (+65.7% YoY)
- Q4 FY26 EPS: ₹12.50 (approx. — from 9.0% PAT margin on ₹774 Cr)
Why Q4 FY26 EBITDA Margin Compressed Despite Revenue Explosion
Margin fell to 12.5% in Q4 from the 14–15% range in Q1–Q3 FY26. The reason is the revenue mix: the IndiaAI Mission order was predominantly AI server hardware — GPUs, storage, interconnects — which carry lower assembly margins than HPC systems or private cloud contracts. As the mix normalises in FY27 and Netweb shifts toward integrated systems (higher margin), management has guided for 200–300 bps margin improvement.
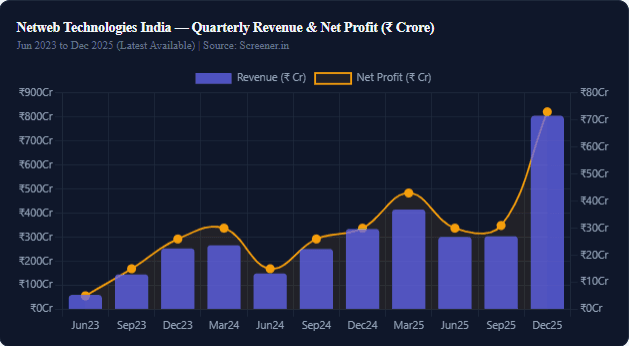
Netweb Technologies India — Quarterly Results Breakdown

Netweb Technologies India — Quarterly Financial Data (₹ Crore)| Quarter | Revenue | Op. Profit | OPM% | Net Profit | EPS (₹) |
|---|
| Jun 2023 | 60 | 9 | 14% | 5 | 0.98 |
| Sep 2023 | 145 | 19 | 13% | 15 | 2.70 |
| Dec 2023 | 253 | 34 | 14% | 26 | 4.64 |
| Mar 2024 | 266 | 40 | 15% | 30 | 5.26 |
| Jun 2024 | 149 | 20 | 13% | 15 | 2.70 |
| Sep 2024 | 251 | 36 | 14% | 26 | 4.64 |
| Dec 2024 | 334 | 43 | 13% | 30 | 5.27 |
| Mar 2025 | 415 | 59 | 14% | 43 | 7.52 |
| Jun 2025 | 301 | 45 | 15% | 30 | 5.38 |
| Sep 2025 | 304 | 45 | 15% | 31 | 5.55 |
| Dec 2025 | 805 | 98 | 12% | 73 | 12.94 |
Dec 2025 Quarter: The Statement Quarter
December 2025 was the quarter that told the entire market that Netweb Technologies India had arrived. Revenue of ₹805 crore — more than the previous three quarters combined — driven by IndiaAI Mission deliveries. Net profit of ₹73 crore, up 142% YoY. EPS of ₹12.94, more than the full FY24 EPS. The stock rose 39% in one week after these results.
The Seasonality Pattern
Netweb’s quarterly pattern is lumpy — Q1 is always the softest (government budget cycle resets, procurement decisions take time) and Q3/Q4 are the strongest. This is a structural feature of a company heavily dependent on government and PSU orders. Investors who panic-sell on weak Q1 numbers miss the full-year picture. FY27 Q1 (April–June 2026) will likely look optically weak — that is not a fundamental deterioration, just the seasonal pattern repeating.
AI Segment: The 459% Growth Story Inside Netweb Technologies India

Three years ago, Netweb Technologies India barely had an AI business. In FY26, it contributed 43.4% of total revenue. That kind of segment-level transformation in three years is exceptional.
What Changed: The IndiaAI Mission
India’s government launched the IndiaAI Mission with a ₹10,371 crore budget to build sovereign AI compute infrastructure. The mission’s first major procurement: 10,000+ GPU-equivalents to be deployed at government data centres across India. Netweb Technologies India secured the landmark ₹1,734 crore AI server deal to supply and deploy this infrastructure. It was the largest AI hardware contract awarded within India.
Why Netweb and Not a Foreign Vendor?
The IndiaAI Mission explicitly prioritises domestic manufacturing under Make in India norms. Foreign vendors like Dell, HPE, or Lenovo cannot qualify unless they manufacture domestically. Netweb’s end-to-end Indian manufacturing — PCB design, chassis fabrication, system integration, software stack — uniquely qualifies it for these sovereign procurement orders.
AI Segment Revenue Mix Shift
| Segment | FY24 Share | FY25 Share | FY26 Share | YoY Change |
|---|
| AI Systems | ~8% | ~15% | 43.4% | +28 pp |
| HPC / Supercomputing | ~35% | ~30% | ~22% | Declining share (not absolute) |
| Private Cloud / HCI | ~25% | ~25% | ~18% | Stable |
| Data Centre / HPS | ~32% | ~30% | ~16.6% | Stable |
NVIDIA Dependency: The GPU Supply Risk
Approximately 70% of Netweb’s AI systems revenue uses NVIDIA GPUs. Netweb rose 4.5% on the day Nvidia reported strong Q1 2026 results, illustrating the tight correlation. This dependency cuts both ways: when Nvidia thrives, MTAR wins orders; when US export controls restrict GPU supply to India, Netweb’s AI order execution can get delayed.
Netweb’s Response: AMD and Domestic Chip Partnerships
Netweb is actively diversifying its AI system supply chain — working with AMD, Intel accelerators, and emerging Indian AI chip initiatives. The new 15,000 sq ft facility for dense GPU systems and liquid-cooled architectures supports both NVIDIA and non-NVIDIA configurations. This supply chain diversification is a medium-term risk mitigator.
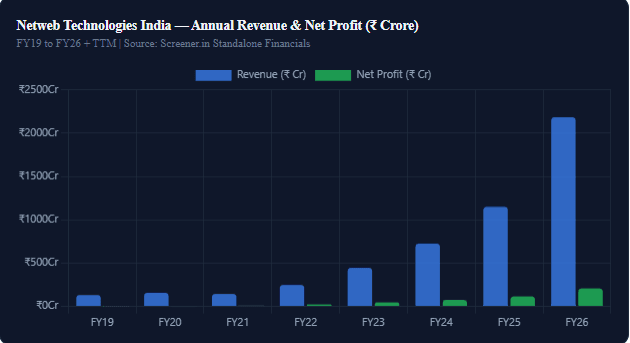
Netweb Technologies India — Revenue, Profit & Key Ratios (FY19–FY26)

Netweb Technologies India — Annual Financial Summary (₹ Crore)| Year | Revenue | Net Profit | OPM% | EPS (₹) | ROCE% |
|---|
| FY2019 | 130 | 3 | 5% | 4.74 | – |
| FY2020 | 156 | 4 | 5% | 6.91 | 31% |
| FY2021 | 143 | 8 | 10% | 14.55 | 36% |
| FY2022 | 247 | 22 | 14% | 39.68 | 52% |
| FY2023 | 445 | 47 | 16% | 9.22 | 64% |
| FY2024 | 724 | 76 | 14% | 13.47 | 38% |
| FY2025 | 1,149 | 114 | 14% | 20.21 | 32% |
| FY2026 | 2,184 | 206 | 13.3% | 36.30 | 37.5% |
| TTM (FY27 partial) | 1,825 | 178 | 14% | 31.39 | – |
CAGR Summary: The Growth Machine
| Metric | 3-Year CAGR | 5-Year CAGR | TTM Growth |
|---|
| Revenue | 67% | 49% | 82% |
| Net Profit | 72% | 96% | 76% |
| Stock Price | ~42% | ~N/A (listed 2023) | 186% |
| ROE | 29% (3Y avg) | 31% (5Y avg) | 32.9% |
A 5-year profit CAGR of 96% is exceptional by any standard. It puts Netweb Technologies India in the same rare category as India’s fastest-compounding businesses. Use our CAGR calculator to compute what a ₹1 lakh investment at any point in this growth curve would have become today.
Balance Sheet: Clean and Lean
- Borrowings: ₹8 crore (FY25) — near zero; CRISIL upgraded to A (Stable)
- Reserves: ₹519 crore (FY25), growing rapidly
- Cash from Operations: ₹171.5 crore in FY26 — a major positive (FCF turning positive)
- Net Free Cash (Mar 2026): ₹83.3 crore — zero net debt company
- Working Capital Days: 84 days (FY26) — increased due to strategic inventory build for large AI orders
For long-term investors, a zero-net-debt company with 37.5% ROCE and 32.9% ROE growing revenue at 90% is a genuinely rare find. Whether the current PE of 112x is justified depends entirely on whether FY27 executes the 49% revenue growth guidance. Track returns on your investment using our stock return calculator.
Shareholding Pattern: Who Is Buying Netweb Technologies India?

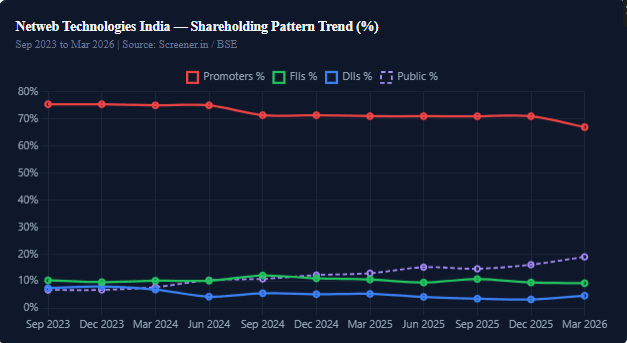
Netweb Technologies India — Shareholding Pattern (%)| Category | Mar 2024 | Mar 2025 | Mar 2026 | Change (2Y) |
|---|
| Promoters | 75.04% | 71.03% | 66.98% | −8.06 pp |
| FIIs (Foreign) | 10.21% | 10.67% | 9.29% | −0.92 pp |
| DIIs (Domestic Inst.) | 6.93% | 5.34% | 4.68% | −2.25 pp |
| Public / Retail | 7.84% | 12.97% | 19.03% | +11.19 pp |
| No. of Shareholders | 80,839 | 1,67,314 | 2,43,292 | +200% in 2 years |
Reading the Shareholding Story
Promoter Decline: Cause for Concern?
Promoter holding has fallen from 75.04% in March 2024 to 66.98% in March 2026. The last quarter saw a −4.02% drop. Some of this is structural dilution from IPO-related unlocks and ESOPs. However, the recent open-market sales (noted by Screener as a ‘con’) should be monitored. The promoter group remains a majority shareholder at 66.98%, which is still high — but the direction matters.
Retail Surge: 2.43 Lakh Shareholders
The number of shareholders has grown from 80,839 to 2,43,292 in just two years — a 200% surge. This is primarily retail investors entering on the AI/HPC story. While it adds liquidity and market interest, heavy retail participation in a stock also means sharper corrections when sentiment turns.
FII and DII: Institutions Watching Closely
FII holding at 9.29% and DII at 4.68% is modest. The real institutional action is happening in the meetings: GIC (Singapore sovereign wealth fund), Aberdeen Group, ICICI Securities, and BofA Securities all met with Netweb management in May 2026. If these meetings convert to portfolio positions, the institutional shareholding data will look very different in the September 2026 update.
Technical Analysis: RSI, MACD & Moving Averages for Netweb Technologies India
The technical picture for Netweb Technologies India on May 29, 2026 is Strongly Bullish — 12 bullish indicators vs just 1 bearish. But the RSI is near overbought territory, which means short-term traders should exercise caution even as the long-term trend is positive.
Key Technical Indicators (May 29, 2026)
| Indicator | Value | Signal |
|---|
| RSI (14) | 69.93 | Near Overbought |
| MACD (12, 26, 9) | +11.42 | Bullish |
| Beta | 0.84 | Volatile like market |
| Overall Technical Summary | 12 Bullish / 1 Bearish | Strongly Bullish |
Support and Resistance Levels
| Level | Price (₹) | Significance |
|---|
| Current Price | ₹4,486.50–₹4,521 | Near 52-week high |
| R3 | ₹4,027.66 | Near-term resistance zone |
| R2 | ₹3,984.83 | Next key resistance |
| R1 | ₹3,917.61 | First resistance on pullback |
| Pivot | ₹3,874.78 | Key pivot level |
| S1 | ₹3,807.56 | First support |
| S2 | ₹3,764.73 | Strong support zone |
| S3 | ₹3,697.51 | Deep support |
Moving Averages: All Bullish Alignment
| Period | SMA (₹) | EMA (₹) | Price vs MA |
|---|
| 10D | 3,915.38 | 4,018.29 | Price above both ✅ |
| 20D | 4,028.48 | 3,961.53 | Price above both ✅ |
| 50D | 3,689.24 | 3,778.17 | Price above both ✅ |
| 100D | 3,485.40 | 3,577.01 | Price above both ✅ |
| 200D | 3,343.78 | 3,276.02 | Price above both ✅ |
Price above all five key moving averages — 10D, 20D, 50D, 100D, 200D — is a strong bullish confirmation. The RSI at 69.93 is approaching but not yet in the overbought zone (70+). A pullback to the 20D SMA around ₹4,028 would be a technically healthy correction and a potential entry zone. Use our stop loss calculator to set appropriate downside protection before adding positions near highs.
Valuation: Is Netweb Technologies India Share Price Expensive?
At ₹4,521 and a PE of 112.59x, Netweb Technologies India is undeniably expensive on trailing earnings. The industry PE is 67.71x — Netweb trades at a 66% premium to peers. But the question is not whether it is expensive on backward-looking metrics; it is whether the forward earnings justify the current price.
Valuation Metrics Comparison
Netweb Technologies India vs Industry — Valuation Comparison| Metric | Netweb (NETWEB) | Industry Avg | Premium/Discount |
|---|
| PE Ratio (TTM) | 112.59x | 67.71x | +66% premium |
| P/B Ratio | 32.04x | ~6–8x (IT avg) | Significant premium |
| EPS (TTM) | ₹36.15 | – | Growing fast |
| ROE | 28.46% | ~18–22% | Above average |
| ROCE | 37.5% (FY26) | ~20–25% | Significantly above |
| Debt/Equity | 0.39 | Variable | Near debt-free |
| Revenue CAGR (3Y) | 67% | ~12–18% | 4–5x industry growth rate |
The Forward PE Calculation
FY27 estimated EPS is ₹60 (based on ₹340 crore PAT / ~5.72 crore shares).
At the current price of ₹4,521, the forward PE on FY27 estimates is approximately 75x.
That is still a premium — but it is directionally moving toward a more reasonable number as earnings catch up with the stock price.
Use our PE ratio calculator to model different earnings scenarios against the current price.
Compare this valuation journey with similar high-growth Indian tech stories covered on MoneyOra — for instance, MTAR Technologies share price which trades at 224x PE on its clean energy and defence growth story, or Enviro Infra Engineers share price which reflects India’s infrastructure buildout theme. Both share the characteristic of high PE multiples justified by structural sector tailwinds.
Bull Case vs Bear Case for Netweb Technologies India
Bull Case — Why Netweb Technologies India Can Keep Rising- IndiaAI Mission Phase 2: The first ₹10,371 Cr tranche is just the beginning. Each new tranche = new orders for Netweb as the only qualified domestic manufacturer
- AI segment now 43% of revenue: Growing from near-zero in 3 years; next 3 years could take it to 60–70% of revenue at much higher margins
- Zero net debt + CRISIL A upgrade: Balance sheet supports aggressive capacity expansion. Bank facility raised to ₹700 Cr for working capital
- New 15,000 sq ft GPU facility: Liquid-cooled, dense GPU systems capacity coming online in H2 FY27
- Pipeline of ₹4,431 Cr: 2x the FY26 revenue — highest revenue visibility in company history
- Institutional recognition: GIC, Aberdeen, BofA all meeting management — position-building likely ahead
- 5-year profit CAGR of 96%: The compounding engine is intact
- Analyst consensus target ₹4,500 → bull target ₹6,000: 33% upside from current levels in the bull scenario
Bear Case — Risks to Netweb Technologies India Share Price- Q4 FY26 = 35% of full-year revenue: Lumpy execution means FY27 Q1 will look weak; risk of sentiment reset
- NVIDIA dependency: US export controls on GPU exports to India could delay AI order execution
- PE at 112x: Any earnings miss or guidance cut triggers sharp downside; priced for perfection
- Promoter decline: Holding fell 4.02% last quarter — consistent selling by insiders is a flag
- Government procurement risk: Budget delays, order cancellations, or policy changes in IndiaAI Mission timelines
- Margin compression: As AI hardware (lower margin) becomes larger share, EBITDA margins may structurally settle at 12–13% vs earlier 16%
- Scale competition: Global players like Nvidia, HPE, Dell could ramp Indian manufacturing via PLI schemes and challenge Netweb’s procurement advantage
Netweb Technologies India Share Price Target: FY26, FY27, FY28

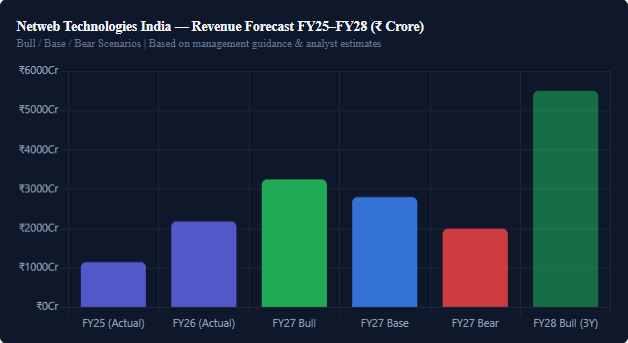
Scenario-Based Share Price Target
Netweb Technologies India Share Price Target — FY27 Scenarios| Scenario | FY27 Revenue | PAT Est. | EPS Est. | PE Applied | Target Price |
|---|
| Bull Case | ₹3,250 Cr | ₹340 Cr | ₹60 | 100x | ₹6,000 |
| Base Case | ₹2,800 Cr | ₹270 Cr | ₹48 | 80x | ₹3,840 |
| Bear Case | ₹2,000 Cr | ₹160 Cr | ₹28 | 60x | ₹1,680 |
| Sell-Side Consensus (3 analysts) | – | – | ₹37.05 (FY27E) | ~108x | ₹4,080–₹4,500 |
*Scenario targets for educational purposes only. Not investment advice. Consult a SEBI-registered investment advisor before any trading or investment decision.
3-Year Base Case Target
Analysts estimate a 3-year base case price target of ₹8,500 for Netweb Technologies India (from the bull-case deep-dive analysis published May 22, 2026). This is based on FY29 estimated revenue of ₹6,000+ crore and PAT of ₹700+ crore at a more normalised 40–50x PE as the company matures. To model what ₹1 lakh grows to at different CAGR assumptions between now and FY29, use our lumpsum calculator.
Analyst Consensus Target: ₹4,080–₹4,500
Three analysts (May 2026) set targets between ₹4,080 and ₹4,500. Given today’s price of ₹4,521, the stock is at the high end of the current consensus range. The bullish deep-dive (Univest, SEBI-registered) has a 12-month probability-weighted target of ₹4,565 and bull case of ₹6,000. This means at the current price, you need the bull case to materialise for meaningful upside from here.
Netweb Technologies India — How It Fits Your Broader Stock Portfolio
Every stock makes more sense in context. If you are tracking Netweb Technologies India for its AI and defence technology angle, here is how it relates to other stories on MoneyOra that share similar structural themes:
Related High-Growth Indian Tech & Infrastructure Stocks on MoneyOra
- MTAR Technologies Share Price — India’s precision engineering play for defence, nuclear energy, and Bloom Energy fuel cells. Like Netweb, it trades at a high PE (224x) on the back of structural sector tailwinds. Our full analysis covers its FY26 results, VNB metrics, and FY27 50% revenue guidance.
- LIC Q4 Results FY2026 — India’s largest institutional investor with ₹57 lakh crore AUM and 200 million policyholders. A contrast study: LIC at 5x PE vs Netweb at 112x, both are high-conviction Indian macro plays, just at opposite ends of the valuation spectrum.
- Today Gold Rate — When high-valuation growth stocks like Netweb correct sharply, smart investors often rotate partly into gold as a hedge. Track live 22K and 24K gold prices for your portfolio asset allocation.
- Enviro Infra Engineers Share Price Target 2026 — Another Make-in-India infrastructure beneficiary with strong order books, different sector (water infrastructure), similar government procurement dependence.
The Investment Theme: India’s Digital Infrastructure Buildout
Netweb Technologies India sits at the intersection of three of India’s biggest government spending themes: Make in India (domestic manufacturing preference), IndiaAI Mission (₹10,000+ Cr compute buildout), and Digital India (broadband, data centres, government cloud). Companies at intersections of multiple government spending themes tend to have above-average revenue visibility over 3–5 year cycles.
For investors deciding how much of their portfolio to allocate to high-growth, high-PE stories like Netweb, our SIP calculator can model what a systematic monthly investment into a small-cap fund or direct equity position would look like over a 5-year horizon, versus alternatives like our PPF calculator for the risk-free portion of your portfolio.“Netweb and semiconductor stocks both ride India’s chip infrastructure theme”
Related Financial Calculators on MoneyOra
Stock Analysis & Trading Tools
Investment Planning & Returns
- SIP Calculator — Monthly SIP in equity/small-cap funds vs Netweb direct equity
- Lumpsum Calculator — Model a one-time Netweb investment at various return assumptions
- SWP Calculator — Systematic withdrawal planning after a large Netweb gain
- FD Calculator — Compare guaranteed FD returns vs Netweb’s equity risk-return
- RD Calculator — Safe savings alongside equity allocation
- PPF Calculator — Tax-free long-term savings to balance high-risk equity positions
- NPS Calculator — Retirement corpus planning alongside equity portfolio
- EPF Calculator — Provident fund balance alongside equity wealth building
Loan & Banking Tools
Conclusion: Netweb Technologies India — The AI Infrastructure Bet India Is Making
Netweb Technologies India at ₹4,521 is not a cheap stock. At 112x PE it is one of India’s most expensive technology names on trailing earnings.
But it is also something very rare — India’s only listed, end-to-end domestic manufacturer of supercomputers, AI GPU systems, and high-performance computing infrastructure. That uniqueness, combined with the government’s multi-thousand-crore IndiaAI Mission backing, creates a revenue visibility and competitive moat that is genuinely hard to replicate.
FY26 delivered 90% revenue growth. The AI segment grew 459%. The company is debt-free. And the FY27 pipeline of ₹4,431 crore is the largest in its history.
The risks are real too. Q4 FY26 was 35% of the full year
if IndiaAI tranches get delayed in FY27, the quarterly numbers will look bad. Promoters are selling.
Nvidia GPU supply chain risk is genuine.
This is not a stock for everyone.
But for investors who understand India’s AI infrastructure story,
have a 3–5 year horizon, and can stomach
PE multiples that look high until earnings catch up
Netweb Technologies India is one of the most consequential positions to be aware of in India’s tech sector right now.
Just size it correctly.
Disclaimer: This article is for informational and educational purposes only. It does not constitute investment advice or a recommendation to buy or sell securities. All data sourced from NSE, Screener.in, Groww, and company filings as of May 29, 2026. Please consult a SEBI-registered investment advisor before making investment decisions. Past performance is not indicative of future results.
Frequently Asked Questions — Netweb Technologies India
What is Netweb Technologies India share price today?
Netweb Technologies India (NSE: NETWEB | BSE: 543945) share price is ₹4,521.30 as of May 29, 2026, up 11.03% (₹449.30) in today’s session. Today’s range is ₹4,050.20 to ₹4,575. The 52-week range is ₹1,700.10 to ₹4,575. Market cap is ₹23,175 crore.
What does Netweb Technologies India do?
Netweb Technologies India designs and manufactures high-end computing systems — supercomputers, AI GPU servers, HPC clusters, private cloud infrastructure, and data centre servers. It is India’s only listed pure-play AI infrastructure company and the primary domestic supplier for the government’s IndiaAI Mission. Its supercomputers have appeared 15 times in the global Top 500 ranking.
What are Netweb Technologies India FY26 full-year results?
FY26 revenue was ₹2,184 crore (+90% YoY). PAT was ₹206 crore (+80.9% YoY). ROCE reached 37.5%, ROE was 32.9%. The AI segment grew 459.6% YoY and now contributes 43.4% of revenue. The company is zero-net-debt with ₹83.3 crore free cash. Order pipeline stands at ₹4,431 crore.
What is the Netweb Technologies India share price target for 2026?
Sell-side consensus target (3 analysts, May 2026) is ₹4,080–₹4,500. Bull case target is ₹6,000 and bear case is ₹1,680 for FY27. The 3-year base case target is ₹8,500. At today’s price of ₹4,521, the stock is at the top of the current consensus range. All targets are for informational purposes only.
Is Netweb Technologies India a good stock to buy?
Netweb Technologies India has a 5-year profit CAGR of 96%, 3-year revenue CAGR of 67%, zero net debt, ROCE of 37.5%, and is the sole listed domestic AI infrastructure manufacturer in India. However, PE at 112x and promoter stake declining from 75% to 67% in two years are risks. It suits high-risk, long-horizon investors aligned with India’s AI buildout. Consult a SEBI-registered advisor before investing.
What is the Netweb Technologies India PE ratio?
Netweb Technologies PE (TTM) is 112.59x as of May 29, 2026. Industry PE is 67.71x. Forward PE on FY27 estimated EPS of ₹60 is approximately 75x. EPS (TTM) is ₹36.15. Book value is ₹127.03 and P/B ratio is 32.04x.
What is the IndiaAI Mission and why does it matter for Netweb?
The IndiaAI Mission is a Government of India programme with ₹10,371 crore in budget to build 10,000+ GPU-equivalent sovereign AI compute infrastructure within India. Netweb Technologies India, as the only qualified domestic manufacturer of full-stack AI servers, is the primary beneficiary. The first tranche delivered in Q3–Q4 FY26 contributed ₹1,734 crore in AI server revenue. Future tranches represent multi-year growth visibility.
Who are the major shareholders in Netweb Technologies India?
As of March 2026: Promoters hold 66.98% (down from 75.04% in March 2024), FIIs hold 9.29%, DIIs hold 4.68%, and public/retail shareholders hold 19.03%. The number of shareholders has grown 200% in two years to 2,43,292. Institutional investors including GIC, Aberdeen, and BofA Securities have been meeting management — suggesting potential large-scale institutional buying ahead.







Pingback: AI Stock Picks 2026: Next 5 Multibagger AI Stocks You Should Know - MoneyOra
Pingback: AI Stocks Picks 2026: Next 5 Best Multibagger AI Stocks
Pingback: Share Market Today: Will Nifty & Sensex Continue Their Bull Run This Week? - MoneyOra
Pingback: Should You Invest in the Defence Index India in 2026? Top Stocks, Returns & Future - MoneyOra
Pingback: MTAR Technologies Share Price Soars 260% in a Year
Pingback: Semiconductor Stocks: Top 5 Multibagger Picks with Real Revenue - MoneyOra
Pingback: Data Center Stocks in India: 9 AI-Boom Picks with Returns Up to 477% Can You Still Join the Party? - MoneyOra