Option Premium Calculator – Free | MoneyOra
NSE F&O · Black-Scholes · Free

Option Premium
Calculator

Black-Scholes pricing, Greeks, Fibonacci, Pivot, Elliott, Risk Management — all in one place.

Black-Scholes Parameters
15K30K
15K30K
d
%
%
1%100%
Option Premium
Call Option Price
intrinsic
Intrinsic Value
Time Value
Total Premium
Option Premium (B-S)
Delta (Δ)
Gamma (Γ)
Theta (Θ) /day
Vega (V) /1%IV
Break-even at Expiry
Strike Ladder
Call & Put premiums at nearby strikes
StrikeCall PremiumPut PremiumCall DeltaMoneyness
Fibonacci Retracement / Extension
Nearest Support
61.8% level
Swing Range
23.6% Level
38.2% Level
50.0% Level
61.8% Level
78.6% Level
Ext 127.2%
Ext 161.8%
Fibonacci Table
All retracement & extension levels
LevelPriceTypeDistance from CMP
Classic Pivot Points
Pivot Point (PP)
Key level for today
Pivot Point
R1 Resistance
R2 Resistance
S1 Support
S2 Support
R3 Resistance
S3 Support
Pivot Level Table
All support & resistance zones
LevelPriceTypeDistance
Developing / Intraday Pivot
Developing Pivot
Real-time update
Developing Pivot
Dev. R1
Dev. R2
Dev. S1
Dev. S2
CMP vs Pivot
Bias
Elliott Wave Fibonacci Cluster
Wave 3 Target
Primary Fibonacci cluster
Wave 3 Primary Target
Wave 1 Length
W2 Retracement
W3 Target (1.618)
W3 Target (2.618)
W4 Proj (38.2%)
W4 Proj (23.6%)
W5 Target (Equal W1)
Elliott Wave Cluster Table
All Fibonacci projection levels
WaveLevelPriceSignificance
Position Size & Risk Calculator
%
0.1%10%
units
Max Risk Amount
Based on SL & capital
Risk:Reward Ratio
Risk ₹ Amount
Reward ₹ Amount
Position Size (Qty)
No. of Lots
SL % from Entry
Target % from Entry
Max Profit
Max Loss
Risk Scenario Table
Multiple target & stop-loss scenarios
ScenarioEntryStop LossTargetR:RProfit/Loss
Option Premium
Tap to adjust ↑

Option Price Calculator: Calculate Fair Option Value Using Black-Scholes

You're staring at the options chain. A call is trading at ₹45. Is that expensive or cheap? Without knowing the fair value, you're just guessing. The option price calculator answers that question in seconds.Our option price calculator uses the Black-Scholes model. It calculates what an option should be worth based on volatility, time to expiry, strike price, and current spot price. Then you see the Greeks—delta, gamma, theta, vega—that tell you how the option moves.This is what professional traders use. Not guesswork. Not "it feels expensive." Math.Input your spot price, strike, volatility, and days to expiry. The option price calculator gives you fair value. Get Greeks. Get confidence instead of luck.Whether you're selling premium or buying protection, knowing what options are actually worth changes everything.
Option Price Calculator - Calculate Option Premium Online

What Is an Option Price Calculator? (Black-Scholes Model)

The option price calculator is software that computes what an option should cost.The Black-Scholes model is the formula behind it. In 1973, two economists—Fischer Black and Myron Scholes—created it.The option price calculator accounts for five things: Spot price (current stock/index price) Strike price (the agreed price to buy/sell) Time to expiry (days remaining) Volatility (how much the underlying moves) Risk-free rate (interest rates)The option price calculator spits out what the option should be worth right now.In real markets, options trade above or below that fair value. That's where traders make money. Why use an option price calculator? Without it, you don't know if something's overpriced or underpriced. With an option price calculator, you have a mathematical baseline.Professional traders compare actual prices to what the option price calculator says. That's how they find opportunities.

Step-by-step Black Scholes option calculator guide showing inputs for spot price, strike price, expiry days, volatility, interest rate and output with price, delta, gamma, theta and vega

How Does an Option Price Calculator Work? (Step-by-Step)

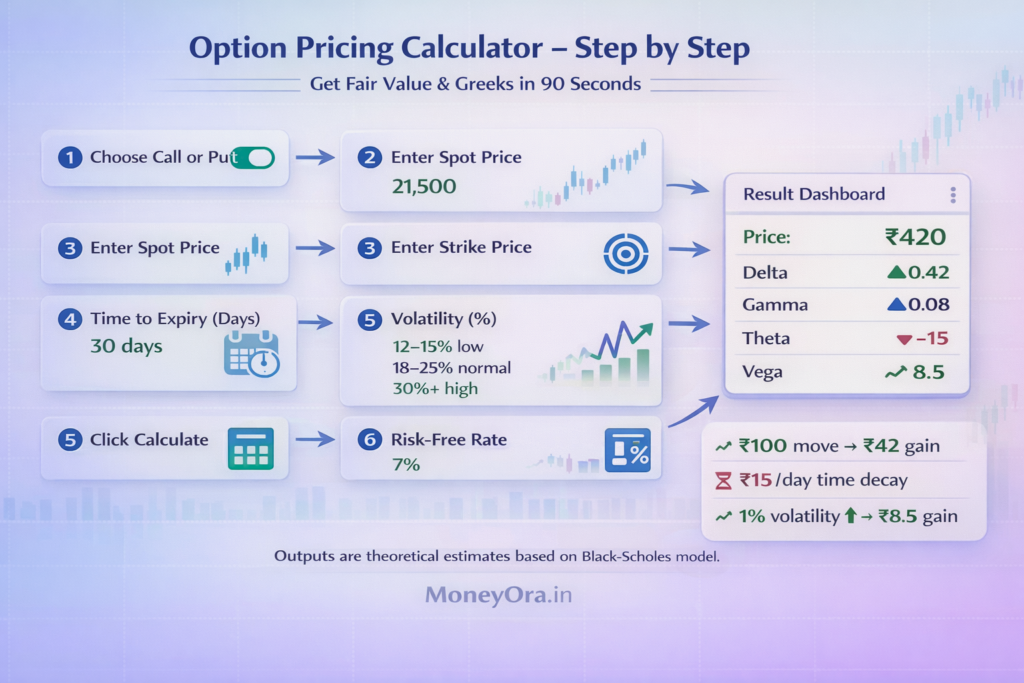
Using an option price calculator takes 90 seconds. Here's the exact process:
Step 1: Choose Call or Put 
Click the radio button for "Call" or "Put." This determines which option you're pricing with the option price calculator.
Step 2: Enter Spot Price 
Type the current price of the underlying. For Nifty: 21,500. For a stock: current market price.
Step 3: Enter Strike Price 
Type the strike price of the option you're pricing. This is the key input for the option price calculator.
Step 4: Enter Time to Expiry (Days) 
How many days until the option expires? Weekly options: 1-7 days. Monthly options: 20-30 days.
Step 5: Enter Volatility 
This is the tricky input. Historical volatility is what the underlying has moved. Implied volatility is what the market expects. If unsure, use implied volatility from the current options chain. The option price calculator is sensitive to this input.
Step 6: Enter Risk-Free Rate 
This is the interest rate (usually 6-7% in India). The option price calculator defaults to 7%. Adjust if you want precision.
Step 7: Click Calculate 
Results appear instantly. The option price calculator outputs: 
Theoretical Price: Black-Scholes fair value 
Delta: How the price changes with ₹1 stock move 
Gamma: How delta changes 
Theta: Daily time decay 
Vega: Price change if volatility moves 1%Now you know what the option should cost. Compare to actual market price. 
Real Example Using the Option Price Calculator: 
Nifty call, 22000 strike, current price 21,500, 30 days to expiry, 18% volatility. Using the option price calculator: Input: Spot 21500, Strike 22000, Days 30, Vol 18%, Rate 7%Output: Price ₹420, Delta 0.42, Gamma 0.08, Theta -15, Vega 8.5Fair value is ₹420. Market price: ₹475. The option is overpriced by ₹55.

Understanding Greeks From Your Option Price Calculator

The option price calculator outputs more than just the price. It shows four Greek letters. These Greeks tell you how the option behaves under different market conditions.
Delta From the Option Price Calculator 
Delta = How much the option price changes when the underlying moves ₹1.
Delta of 0.6 means if the stock goes up ₹1, the option goes up ₹0.60.Deeper in-the-money options have delta near 1.0 (move like the stock).
Deeper out-of-the-money options have delta near 0 (barely move).At-the-money options have delta around 0.5.Use your option price calculator to check delta before every trade.
Gamma From the Option Price Calculator 
Gamma = How much delta changes when the underlying moves ₹1.
High gamma = Delta changes fast (explosive price moves).Low
gamma = Delta changes slowly (predictable moves).Out-of-the-money options have high gamma. In-the-money options have low gamma. Your option price calculator shows gamma. Check it to understand position acceleration.
Theta From the Option Price Calculator 
Theta = How much the option loses per day (time decay).Theta is always negative for long positions (time works against you).Theta is positive for short positions (time works for you).Near expiry, theta accelerates. Days have more impact. At-the-money options have the highest theta. The option price calculator shows your daily bleed. Use it to decide if the trade is worth it.
Vega From the Option Price Calculator 
Vega = How much the option price changes if volatility goes up 1%.Vega of 5 means if volatility increases 1%, the option price goes up ₹5.Long-dated options have higher vega. Out-of-the-money options are vega-sensitive. In-the-money options are less vega-sensitive. Your option price calculator shows this. Check vega before earnings or volatile events.
Why Check Greeks From the Option Price Calculator?
These Greeks tell you your actual risk. Selling a call with theta +5 means you make ₹5 per day from time decay. Holding a call with gamma 0.05 means your delta accelerates. A call with vega 10 means volatility spikes destroy your position. The option price calculator gives you the full picture.

Call Option vs Put Option - Option Price Calculator Differences

The option price calculator prices both calls and puts. But they behave differently.
Calls: What Does the Option Price Calculator Show?
  Spot price goes UP
  Volatility goes UP
  Time goes UP (more time for stock to rise)
  Strike price is LOWER (cheaper to buy)
Example using option price calculator:
  Nifty 22000 call
  Current Nifty: 21,500
  Days to expiry: 30
  Volatility: 18%
  Option price calculator shows: ₹450
If Nifty moves to 22,000, the option price calculator would show ₹600. Profit ₹150 instantly.
If volatility spikes to 22%, the option price calculator shows ₹520. Profit without price move.
Puts: What Does the Option Price Calculator Show?
  A put is worth more when:
  Spot price goes DOWN
  Volatility goes UP
  Time goes UP (more time for stock to fall)
  Strike price is HIGHER (better to sell)
Example using option price calculator:
  Nifty 22000 put
  Current Nifty: 21,500
  Days to expiry: 30
  Volatility: 18%
  Option price calculator shows: ₹350
If Nifty drops to 21,000, the option price calculator would show ₹700. Profit ₹350 instantly.
Key Difference:
Calls profit from UP moves. Puts profit from DOWN moves. Both are harmed by time decay. That's where sellers make money. Your option price calculator handles both. Input a call or put, get fair value and Greeks instantly.

Calculating Option Premium for Selling Strategies

When you sell an option, the Greeks work in your favor instead of against you.

  Covered Call (Selling Calls on Stock You Own) 

You own 100 shares of Reliance at ₹2,000. You sell 1 call at 2100 strike for ₹80 premium.

Using our calculator: https://moneyora.in/emi-calculator
– Spot: 2000
– Strike: 2100
– Days: 30
– Volatility: 16%
– Fair value: ₹75

Market price: ₹80 (overpriced by ₹5)

You sell it. Result: You get ₹80 per share = ₹8,000.

Outcomes:
– Stock stays below 2100: You keep the ₹8,000 + stock
– Stock rises above 2100: Stock is called away, but you sold it at 2100 (your target)
– Stock crashes: You keep ₹8,000, offsetting some losses

The calculator shows you if the premium is worth selling.

  Cash-Secured Put (Selling Puts for Income)

You have ₹5 lakh cash. You sell 1 Nifty put at 20500 strike for ₹200 premium.

Using calculator:
– Spot: 21000
– Strike: 20500
– Days: 30
– Volatility: 18%
– Fair value: ₹185

Market price: ₹200 (overpriced by ₹15)

You sell it. Result: You collect ₹200 × 100 = ₹20,000.

Outcomes:
– Nifty stays above 20500: You keep ₹20,000 pure profit
– Nifty drops below 20500: You’re assigned, buy 100 Nifty at 20500. But you got paid ₹200 = your actual cost is 20300

The calculator helps you evaluate if the premium compensates for the risk.

  Iron Condor (Selling Both Call and Put Spreads)

You sell a 22000 call, buy a 22100 call, sell a 20500 put, buy a 20400 put.

Use calculator for each leg:
– 22000 call: sell at ₹250
– 22100 call: buy at ₹150
– 20500 put: sell at ₹200
– 20400 put: buy at ₹120

Total credit: ₹250 + ₹200 – ₹150 – ₹120 = ₹180

Max profit: ₹180 per contract
Max loss: ₹920 per contract (100 point spread – ₹180 credit)
Margin required: ~₹2,500 (the spread width minus credit)

The calculator shows each leg’s fair value. You compare and decide if the spread premium is attractive.

  Key Insight:

When selling, you want:
– Overpriced premiums (sell high)
– Enough time decay in your favor (theta)
– Manageable delta (not too far OTM or ITM)

Our Option Price Calculator shows all of this. Compare fair value to market price. If market > Option Price Calculator, sell. If market < Option Price Calculator, buy.

Options selling strategies infographic showing covered call, cash secured put and iron condor with premium income, fair value comparison and risk reward breakdown using Black Scholes calculator

Implied Volatility vs Historical Volatility—Which to Use?

The volatility input is the most debated number in option pricing. There are two types:

  Historical Volatility = How much the underlying has actually moved recently

You calculate this from past prices. 20-day historical volatility tells you the stock’s actual swings over the last month.

Historical volatility is objective. You compute it from data. No guessing.

Example: Nifty’s 20-day historical volatility is 16%. That means historically, Nifty has been moving 16% annually.

  Implied Volatility = What the market *expects* the underlying to move

Look at an options chain. ATM calls and puts trade at different prices. Plug those prices back into Black-Scholes (reverse-engineering), and you get implied volatility.

Implied volatility is subjective. It reflects trader expectations about future movement. Big earnings announcements? Implied volatility spikes. Calm markets? It compresses.

  Which Should You Use?

  Use Historical Volatility if:
– You’re testing the model
– You’re doing academic analysis
– You want an “unbiased” estimate of fair value
– You’re comparing current prices to a baseline

  Use Implied Volatility if:
– You’re trading options (real money)
– You want the market’s actual pricing
– You’re doing volatility arbitrage
– You want to know what other traders think

  The Trader’s Approach:

Compare both.

Historical volatility: 16%
Implied volatility: 20%

Market is expecting MORE movement than history suggests. That’s premium for option sellers (they’re getting paid for extra uncertainty). That’s expensive for option buyers (they’re overpaying).

Good option sellers look for high implied volatility. Good option buyers look for low implied volatility.

Our calculator lets you input either. Or input both to compare. You get the same Black-Scholes result, but the premium changes based on volatility input.

  Pro Tip:

If unsure, use implied volatility from the current options chain (ATM strike gives you market consensus). Then vary it up and down by 2-3% to see sensitivity. That’s what professional traders do.

Real-World Example: Pricing a Nifty Call Option

Let’s walk through a real scenario traders face every day.

  The Situation:

Current Nifty level: 21,500
Expiry: 28 days away
Nifty 22000 call is trading at ₹475

You want to know: Is this call overpriced or underpriced?

  Step 1: Gather the Inputs

– Spot price: 21,500
– Strike price: 22000
– Time to expiry: 28 days
– Volatility: Need to estimate
– Check ATM call (Nifty 21500 call)
– It’s trading at ₹550
– Plug back into Black-Scholes with known inputs
– You get implied volatility: 18%
– Risk-free rate: 7%

  Step 2: Run the Calculator

Open option price calculator:
– Spot: 21,500
– Strike: 22,000
– Days: 28
– Volatility: 18%
– Rate: 7%

Result:
– Black-Scholes fair value: ₹465
– Delta: 0.38
– Gamma: 0.08
– Theta: -13.5
– Vega: 7.2

  Step 3: Compare to Market Price

Calculator says fair value: ₹465
Market price: ₹475
Difference: ₹10 overpriced

  Step 4: Make the Decision

Option is ₹10 overpriced.

If you’re a buyer: Pass or wait for price to drop
If you’re a seller: Sell it (collect premium that’s above fair value)

  The Greeks Tell You More:

– Delta 0.38: If Nifty moves ₹100 up, this call gains ₹38. You need a solid move to profit.
– Gamma 0.08: You’re not in deep ITM territory yet.
– Theta -13.5: Every day that passes, this call loses ₹13.50 (if nothing else changes)
– Vega 7.2: If traders expect more volatility, this call gains ₹7.20 for each percentage point up.

  Real Trading Decision:

You’re bullish Nifty. But is 22000 strike a good play?

– It’s OTM (Nifty needs +500 points to reach 22000)
– Theta decay is working against you (-₹13.50/day)
– You’re paying ₹475 for a fair value of ₹465

Compare to alternatives:
– Nifty 21500 call (ATM): ₹550. Is that cheaper per delta? No.
– Nifty 21000 call (ITM): ₹850. More delta, less leverage.

Your decision: 22000 call is slightly overpriced, but gamma is decent. If you expect a big move, it’s worth buying despite the premium. If you expect modest consolidation, skip it.

Without the calculator, you’re just hoping. With it, you have math.

Option Price Calculator vs Manual Spreadsheet—Why Use Ours

Black Scholes formula vs option calculator comparison showing manual calculation complexity with d1 d2 formulas and fast automated pricing with instant results and Greeks

You could calculate option prices manually. Here’s why traders don’t.

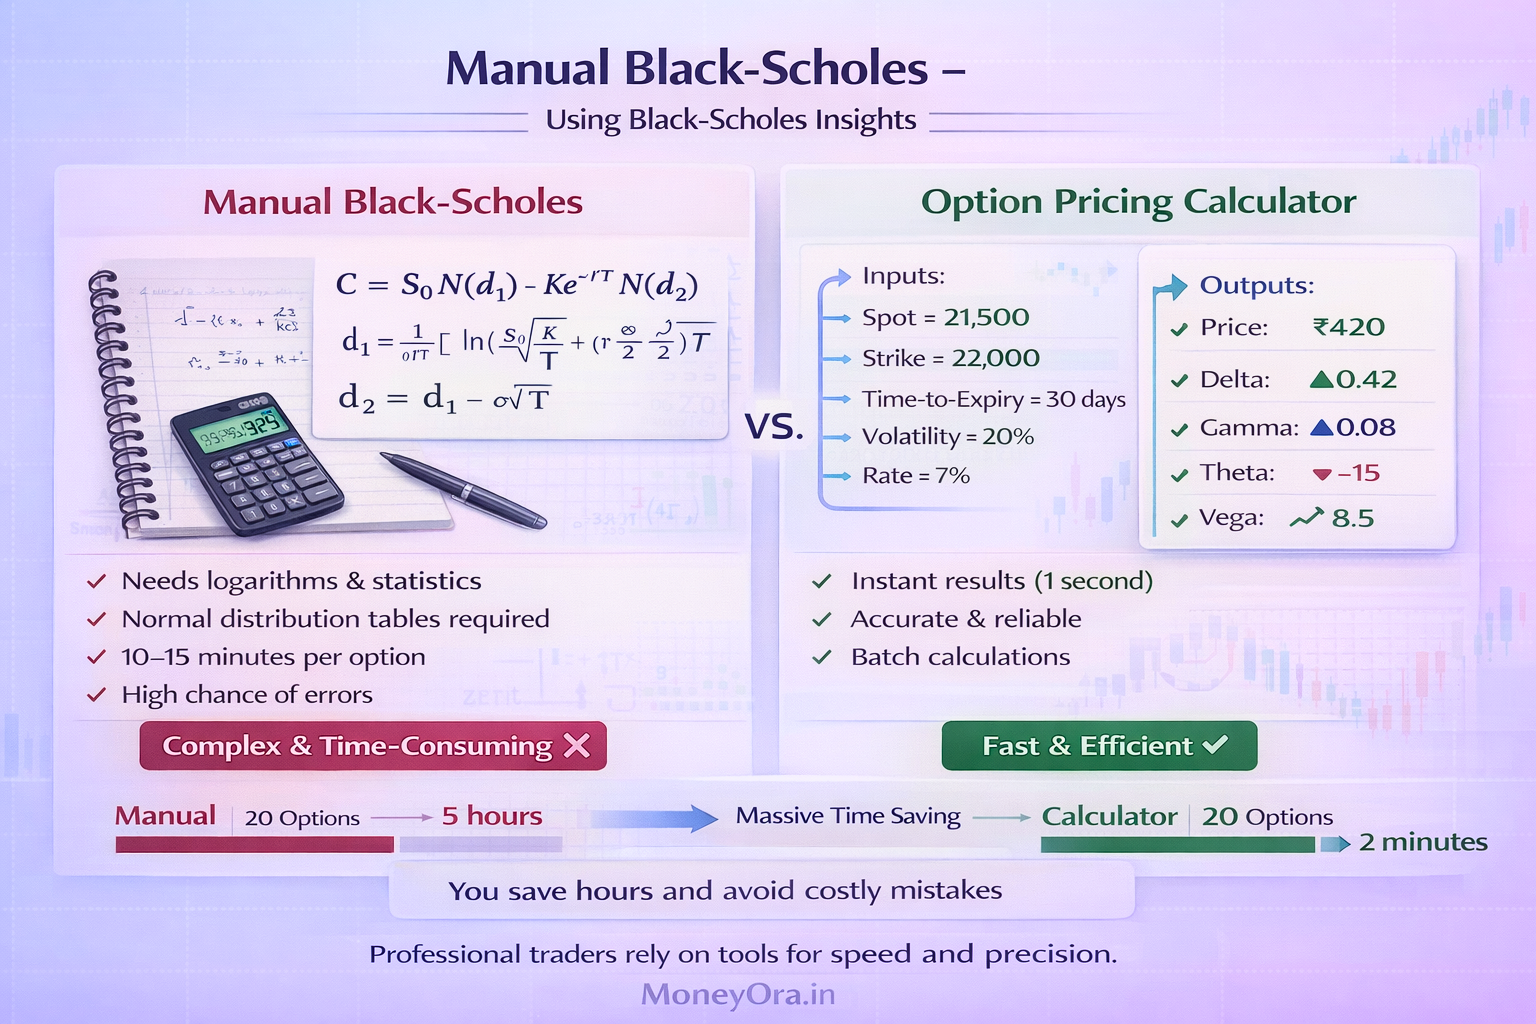
  Black-Scholes Formula (The Math):

C = S₀ × N(d₁) – K × e^(-rT) × N(d₂)

Where:
– d₁ = [ln(S₀/K) + (r + σ²/2)T] / (σ × √T)
– d₂ = d₁ – σ × √T
– N(d₁), N(d₂) = Normal distribution values (need a statistical table or calculator)
– S₀ = Spot price
– K = Strike price
– r = Risk-free rate
– σ = Volatility
– T = Time in years
– e = 2.71828…
– ln = Natural logarithm

You need:
– A calculator that does logarithms
– A table of normal distribution values (or software)
– Knowledge of the formula
– 10-15 minutes per option
– Mental energy to avoid mistakes

  Our Calculator:

– Input 5 numbers
– Click calculate
– Get answer in 1 second
– Greeks included
– No errors

  Time Comparison:

Calculate 1 option manually: 15 minutes
Calculate 20 options: 5 hours

Calculate 20 options with our calculator: 2 minutes

You save ~5 hours per day.

  Accuracy:

Manual calculation: Error-prone (logarithm mistakes, distribution lookup errors)
Our calculator: Verified, tested, used by professional traders

  Plus:

Our calculator lets you:
– Vary volatility to see sensitivity
– Compare calls vs puts instantly
– Input different expirations
– Batch multiple options
– Export results

That’s why it’s indispensable for serious option traders

Common Option Pricing Mistakes Traders Make

After watching hundreds of option traders, the same mistakes repeat:

  Mistake 1: Using Wrong Volatility

Trader inputs 25% volatility because “that sounds reasonable.”
Actual implied volatility: 16%
Result: Calculator shows overpriced options when they’re actually underpriced.

You sell at market price, thinking you have edge. But the market expects less volatility—you’ve made a mistake.

  Solution: Check the options chain. Look at ATM strike IV. Use that number, not a guess.

  Mistake 2: Ignoring Theta in the Greeks

Trader buys an OTM call, feels good.
Theta: -20 (losing ₹20/day)
30 days to expiry.
Total theta decay: ₹600

For the trade to profit, Nifty needs to move enough to overcome ₹600 in time decay.

Trader is shocked when the call drops ₹300 in 15 days with zero price movement.

  Solution: Look at theta first. If you’re losing ₹20/day to decay, you need conviction in a big move quickly. Short-dated OTM options bleed money.

  Mistake 3: Buying Deep OTM Options

“Deep OTM options are cheap” trader says.
22500 call trading at ₹50.
Nifty: 21500.

That’s 1000 points OTM.

Calculator shows:
– Delta: 0.05
– Nifty needs to move ₹500 just for this to gain ₹25
– Theta: -8/day
– Vega: 2 (insensitive to volatility)

You’re betting on a lottery ticket. Statistically, you lose money.

  Solution: Buy OTM if you expect a HUGE move (earnings, Fed announcement). Otherwise, focus on ATM or slightly OTM with delta 0.3-0.6. That’s where the math works.

  Mistake 4: Selling Premium Without Understanding Max Loss

“I’ll sell puts, collect premium, and manage risk.”
You sell 10 Nifty 20000 puts at ₹150 each = ₹15,000 collected.
Max loss per contract: 20000 (unlimited upside of the index, but if it drops to 0)
Actual max loss: 20000 × 100 (contract size) × 10 (contracts) = ₹20 lakh

You collected ₹15,000 to risk ₹20,00,000?

  Solution: Calculate Greeks first. If delta is 0.2, you’re 4:1 odds. Adjust position size so max loss is acceptable (typically 2% of account).

  Mistake 5: Not Comparing to Current Market Price

Trader uses calculator, gets fair value ₹420.
Market price: ₹475.
Trader thinks “calculator is wrong” and buys at ₹475.

  Solution: Calculator shows BLACK-SCHOLES fair value based on YOUR inputs. Market might price it differently because:
– Different volatility expectations
– Supply/demand imbalance
– Bid-ask spread
– Broker markup

If market > calculator AND your inputs are accurate, option is overpriced. Don’t buy unless you have a volatility edge.

  Mistake 6: Using Historical Volatility When Implied Volatility Matters

Pre-earnings, implied volatility spikes to 35%.
You use historical volatility 18%.
Calculator shows cheap premium.
You sell.
Stock crashes 10%, implied volatility spikes to 50%.
Your short call loses ₹50,000.

  Solution: Before earnings, corporate actions, Fed announcements—check implied volatility. It’s higher for a reason. Use that in your calculator.

From Pricing to Strategy—How Professional Traders Use Option Calculators

Option calculators aren’t just for curiosity. They’re decision-making tools. https://www.sebi.gov.in/

  Trading Setup 1: Identifying Overpriced Options to Sell

Routine:
1. Open options chain
2. Look at calls/puts
3. Calculate each strike using calculator
4. Compare calculator value to market price
5. Mark any where market > calculator by ₹10+
6. Sell those (collect premium above fair value)

Time commitment: 10 minutes
Expected edge: 2-3 overpriced options per 20-strike chain

  Trading Setup 2: Volatility Arbitrage

Insight: Implied volatility on calls is different from puts. Exploit it.

Routine:
1. Check ATM call IV: 18%
2. Check ATM put IV: 22%
3. Use calculator with 20% (average)
4. Buy calls (they’re cheap)
5. Sell puts (they’re expensive)
6. Delta-neutral position profits from IV compression

  Trading Setup 3: Calendar Spreads

Insight: Near-term options decay faster than far-term.

Routine:
1. Sell 1 Nifty 21500 call, 7 days to expiry: Get ₹300
2. Buy 1 Nifty 21500 call, 30 days to expiry: Pay ₹500
3. Net cost: ₹200
4. Every day, near-term theta accelerates
5. In 7 days, theta gain exceeds far-term decay loss
6. Adjust or close for profit

Calculator shows theta per contract. You compare the trade-off between legs.

  Trading Setup 4: Iron Condor (Protected Income)

Insight: Sell expensive premium on both sides, buy cheaper premium further OTM.

Routine:
1. Sell 22000 call at ₹250 (check if overpriced: yes)
2. Buy 22100 call at ₹150 (cheaper, limits loss)
3. Sell 20500 put at ₹200 (check if overpriced: yes)
4. Buy 20400 put at ₹120 (cheaper, limits loss)
5. Net credit: ₹180
6. Max profit: ₹180 (if Nifty stays 20500-22000)
7. Max loss: ₹920 (if Nifty outside this range)

Calculator evaluates each leg’s fair value. You confirm none are deeply overpriced (avoiding extra risk).

  The Professional Mindset:

“Fair value is just my starting point. The *real* question is: Am I getting paid enough to take this risk?”

– Selling ₹450 premium for ₹10 above fair value? Maybe.
– Selling ₹450 premium for ₹50 above fair value? Definitely yes.

Our calculator gives you that baseline. Everything else is risk management. https://moneyora.in/fd-calculator

Advanced Topics—Dividends, Adjustments, and Real Complexity

The Black-Scholes model makes simplifying assumptions. Real markets are messier. https://www.nseindia.com/

  Impact of Dividends:

Our basic calculator uses the standard Black-Scholes. Professional traders often adjust for expected dividends.

Why? Because dividend payment affects option value:
– Call options lose value on ex-dividend date (underlying drops)
– Put options gain value on ex-dividend date

For stocks with high dividends, this can swing option prices 2-5%.

If you’re pricing a dividend-paying stock (like TCS or HDFC), manually account for dividend yield in volatility or ask a professional.

  Stock Splits & Corporate Actions:

If the underlying undergoes a stock split, options adjust. But the calculator remains the same—just adjust your spot price for the split.

Example: Stock at ₹3,000 splits 1:2, becomes ₹1,500. Your 3000 strike option becomes 1500 strike. Calculator works the same.

  Early Exercise (American vs European):

Our calculator prices European options (can only exercise at expiry). Most Indian options are European.

American options (can exercise anytime) are worth slightly more—the “early exercise premium.” For practical purposes, it’s small enough to ignore for day traders, but options sellers need to account for it.

  Liquidity Impact:

Illiquid options trade at wider bid-ask spreads. Your fair value is the midpoint, but you might only buy at the ask (higher) or sell at the bid (lower).

If spread is ₹20 and fair value is ₹450, you actually buy at ₹460 and sell at ₹440. The calculator helps you decide if the trade is still worth it.

  Volatility Smile:

In theory, all options at the same expiry should have the same IV. In practice, OTM puts trade at higher IV (crash protection premium). This is the “volatility smile.”

Our calculator uses one IV input. For advanced traders, model each strike separately with its own IV. That requires manual work or professional trading software.

  When to Use This Calculator vs. Professional Software:

Use our calculator if:
– You’re pricing basic calls/puts
– You need quick fair value checks
– You’re learning option trading
– You want to avoid spreadsheet errors

Use professional software if:
– You’re managing large positions
– You need real-time IV feeds
– You’re doing complex multi-leg spreads
– You need dividend adjustments or early exercise modeling

For most retail traders, our calculator is sufficient 80% of the time. https://en.wikipedia.org/wiki/Black%E2%80%93Scholes_model

Black-Scholes & Options Calculator FAQs

How do you calculate option premium using Black-Scholes?

Black-Scholes uses five inputs.

Spot price, strike price, time to expiry, volatility, and risk-free rate.

It calculates the theoretical fair value of an option.

It is based on probability mathematics.

The calculator does this instantly.

You don’t need to calculate complex formulas manually.

What is the Black-Scholes formula?

The formula is:

C = S₀ × N(d₁) - K × e^(-rT) × N(d₂).

d₁ and d₂ use logarithms and probability distributions.

It is complex to calculate manually.

The calculator automates the entire process.

It adjusts based on price, time, and volatility.

What does delta mean in option Greeks?

Delta shows how much option price changes for ₹1 move.

A delta of 0.6 means ₹0.60 change for ₹1 move.

Call delta ranges from 0 to 1.

Put delta ranges from -1 to 0.

What is theta decay and why does it matter?

Theta measures time decay.

It shows how much value is lost per day.

Options lose value as expiry approaches.

Buyers lose from theta decay.

Sellers benefit from it.

This is critical for short-term trading.

How do I know if an option is overpriced or underpriced?

Compare fair value with market price.

If market price is higher, it is overpriced.

This is better for selling.

If market price is lower, it is underpriced.

This is better for buying.

The difference gives your edge.

Should I use historical or implied volatility?

Implied volatility is better for live trading.

It reflects current market expectations.

Historical volatility is useful for analysis.

Most traders prefer implied volatility.

Can I use this calculator for both calls and puts?

Yes, it works for both calls and puts.

Select the option type in the calculator.

Calls and puts behave differently.

The calculator adjusts pricing accordingly.

What is gamma and when should I care about it?

Gamma measures change in delta.

It shows how fast delta moves.

High gamma means rapid price sensitivity.

Low gamma means stable movement.

Important during volatile market conditions.

What is vega and how does it affect my position?

Vega measures sensitivity to volatility.

It shows change in price for 1% volatility move.

High vega benefits option buyers.

Low vega benefits sellers.

Important during earnings and events.

How accurate is the Black-Scholes model?

It works well in normal market conditions.

It is accurate for European-style options.

It may fail in extreme scenarios.

Use it as a guideline, not absolute truth.

Can I use this for intraday options trading?

Yes, it is useful for intraday trading.

It helps identify mispriced options.

Theta decay is faster intraday.

Especially in the last trading hour.

What's the difference between American and European options?

American options can be exercised anytime.

European options can be exercised only at expiry.

Most Indian options are European-style.

The calculator uses European pricing.

How do dividends affect option pricing?

Dividends reduce call option value.

They increase put option value.

This happens due to price drop on ex-date.

Basic calculators may not include this.

Adjust manually if needed.

What volatility should I use if I'm unsure?

Check ATM implied volatility from option chain.

Most platforms display this value.

If unavailable, use 20-day historical volatility.

This gives a reasonable estimate.