
Dividend Yield
Calculator
Calculate dividend yield and compare returns across stocks and asset classes instantly.
| Purchase Price | Dividend/Share | Yield | Annual Income | Rating |
|---|
Dividend Yield Calculator: 7 Best Ways to Pick Income Stocks
Dividends are one of the most reliable forms of passive income from stocks — but only if you buy the right stocks at the right price. That’s exactly what a dividend yield calculator helps you figure out. It takes the annual dividend a company pays and divides it by the current share price, giving you a percentage that shows how much income you earn per rupee invested. A stock paying Rs 10 dividend at Rs 200 yields 5%. The same stock at Rs 500 yields only 2%. Same dividend, very different income story.
This guide covers how to use a dividend yield calculator for Indian stocks (SBI, Vedanta, ITC, Coal India), global stocks (SCHD, VOO, JEPQ, Coca-Cola, S&P 500), and for building a dividend portfolio that generates reliable monthly income. Use MoneyOra’s free dividend yield calculator alongside this guide to run your own numbers.
What is dividend yield and why it matters
Dividend yield tells you how much income a stock generates relative to its price. A 5% dividend yield on a Rs 1,00,000 investment means Rs 5,000 per year in dividend income — regardless of whether the stock price moves up or down.
That last part is what makes dividends different from capital gains. Capital gains require the stock to rise. Dividends arrive whether the stock rises, falls, or goes nowhere — as long as the company keeps paying.
That said, dividend yield alone is not enough. A 15% yield sounds excellent until you realise it usually means the stock price crashed and the dividend is about to be cut. This is called a “dividend trap” — and the dividend yield calculator is your first filter against it.
Here’s what dividend yield actually tells you when used correctly:
- The income return from a stock at its current price
- Whether a stock’s income is competitive with FD or PPF
- How much total income a portfolio generates annually
- Whether a yield moved because the dividend changed or because the price changed
According to Wikipedia’s article on dividend yield, the metric has been used by income investors for over a century. The S&P 500’s average dividend yield has historically ranged from 1.5% to 5%, with the long-run average near 2%. Indian markets have historically offered higher yields — particularly from PSU companies where the government, as majority shareholder, requires regular dividend payments as a revenue source.
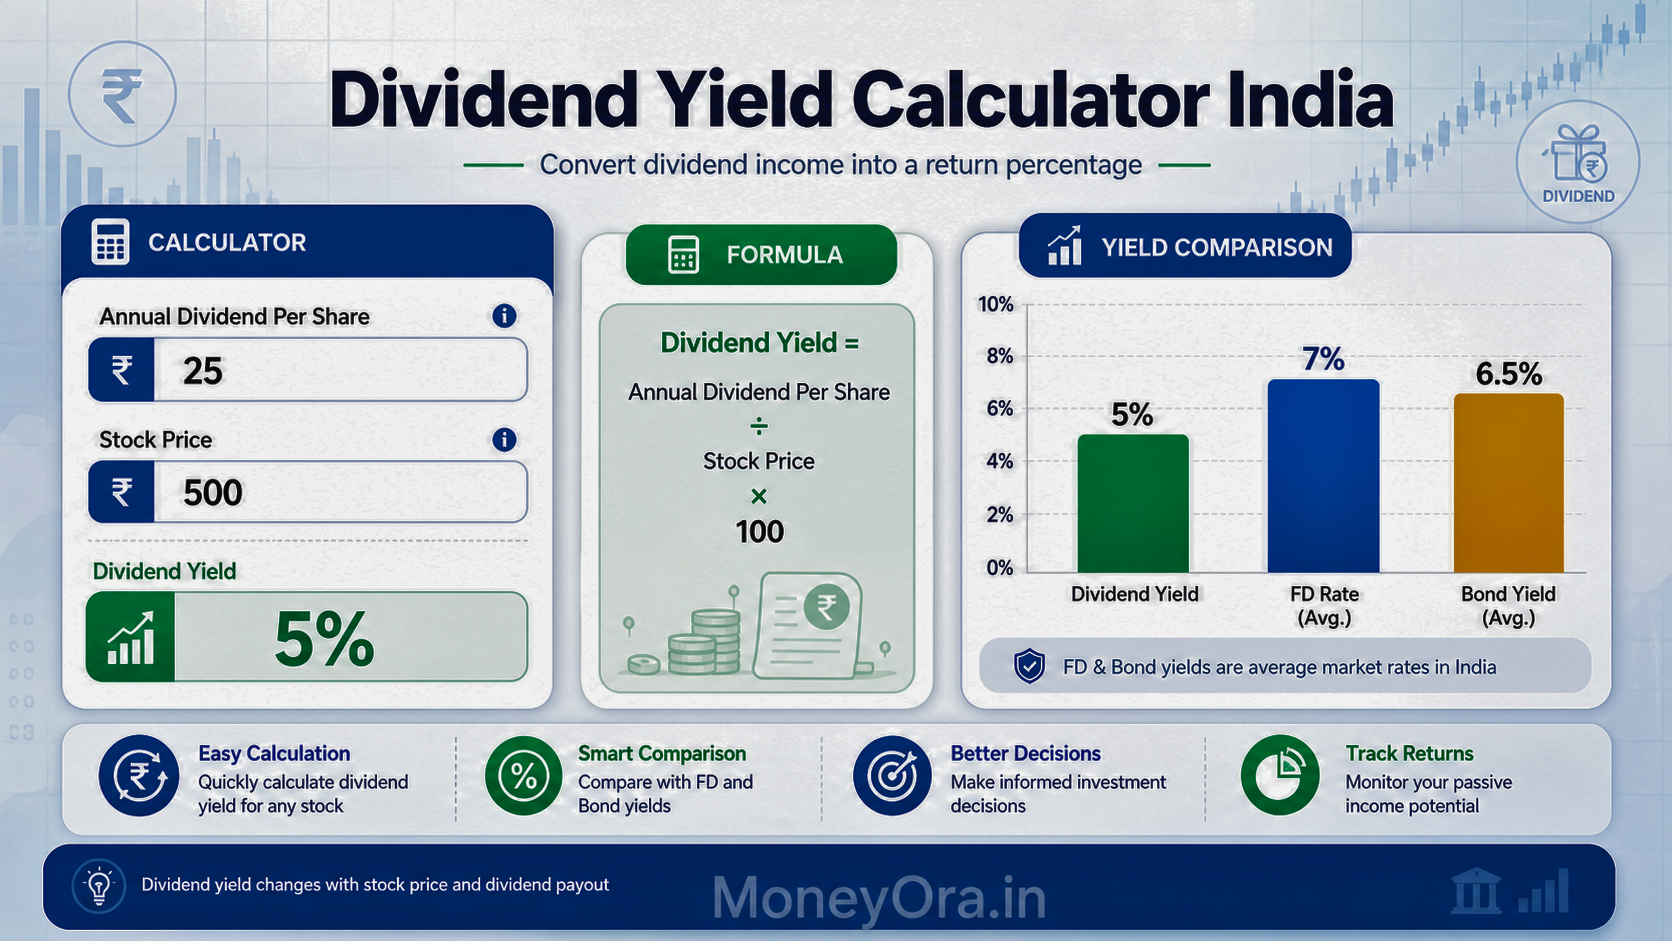
Dividend yield calculator formula — how it works
The formula fits on a sticky note.
Dividend Yield (%) = (Annual Dividend Per Share / Current Share Price) x 100
Three examples with real numbers:
ITC Ltd: Annual dividend Rs 7.50, current price Rs 450. Yield = (7.50 / 450) x 100 = 1.67%
Coal India: Annual dividend Rs 25, current price Rs 400. Yield = (25 / 400) x 100 = 6.25%
Power Grid Corporation: Annual dividend Rs 12, current price Rs 280. Yield = (12 / 280) x 100 = 4.29%
The calculator returns this in one second. The harder question is what these numbers mean for actual investment decisions — which is what the rest of this guide covers.
One thing worth knowing: dividend yield is a trailing metric by default. It uses the most recently paid annual dividend divided by today’s price. The forward dividend yield calculator uses the expected future dividend instead — more useful when a company has just announced a dividend change.
How to calculate dividend per share
This is where Indian investors often get confused — because Indian companies announce dividends differently from most other markets.
Method 1: Rupee amount per share (most common globally)
The company announces: “We are paying a final dividend of Rs 8 per share.” DPS = Rs 8. Annual DPS = sum of all dividends in the financial year. If a company paid Rs 3 interim and Rs 8 final: Annual DPS = Rs 11.
Method 2: Percentage of face value (common in India)
Many Indian companies declare dividends as a percentage of face value — not market price. Face values are typically Rs 1, Rs 2, Rs 5, or Rs 10.
Formula: DPS = (Dividend % x Face Value) / 100
Example: Infosys declares 1750% dividend on Rs 5 face value shares. DPS = (1750 x Rs 5) / 100 = Rs 87.50 per share. This confuses many first-time investors who see “1750% dividend” and think it means 1750% of the market price. It doesn’t. It’s 1750% of the Rs 5 face value.
Method 3: Total dividends paid / shares outstanding
If the company paid Rs 500 crore total and has 250 crore shares outstanding: DPS = Rs 500 crore / 250 crore = Rs 2 per share.
Check NSE or BSE corporate actions for exact dividend announcements. MoneyOra’s dividend calculator accepts DPS in rupee terms directly — once you have the number from the exchange, the yield calculation is instant.
Annual vs monthly dividend yield calculator
Most Indian companies pay dividends once or twice a year — an interim and a final. The annual dividend yield calculator uses the total of both. For US stocks that pay quarterly (SCHD, Coca-Cola, VOO), annual DPS = 4 x quarterly DPS.
The monthly dividend yield calculator is useful for income planning — showing what you’d receive per month if dividend income were spread evenly across 12 months.
Monthly dividend income formula
Monthly Income = (Annual DPS x Number of Shares) / 12
Example: You hold 1,000 shares of Power Grid. Annual DPS = Rs 12. Monthly equivalent = (Rs 12 x 1,000) / 12 = Rs 1,000/month. In practice, that Rs 1,000 arrives as two lump sums per year — but the monthly equivalent helps compare against expenses or FD interest.
Use MoneyOra’s FD calculator for direct comparison: what monthly interest does a fixed deposit give at 7%, versus what a dividend portfolio generates? For most investors in the 20–30% tax bracket, the comparison is more nuanced than it first looks — both FD interest and dividends are now taxed at slab rate, so the advantage shifts to the stock’s capital appreciation potential.
Forward dividend yield calculator — what it is
Trailing dividend yield uses what the company paid last year. Forward yield uses what it’s expected to pay next year.
Forward Dividend Yield = (Expected Annual DPS / Current Share Price) x 100
Forward yield is more useful than trailing in three situations:
- When a company has just cut its dividend — trailing yield will overstate income you’ll actually receive
- When a company declared a one-time special dividend — trailing yield will overstate normal future income
- When a company just announced a dividend hike — trailing yield understates what you’ll receive going forward
For blue-chip stocks with stable histories, trailing and forward yields are usually close. For cyclical stocks — metals, mining, oil — they can differ sharply. Vedanta’s dividend, for example, varies significantly year to year based on commodity prices and group-level cash flows.
Forward dividend data is on NSE, BSE, and screeners like Screener.in and Tickertape. Enter the expected DPS into MoneyOra’s dividend yield calculator alongside current price for the forward yield figure.
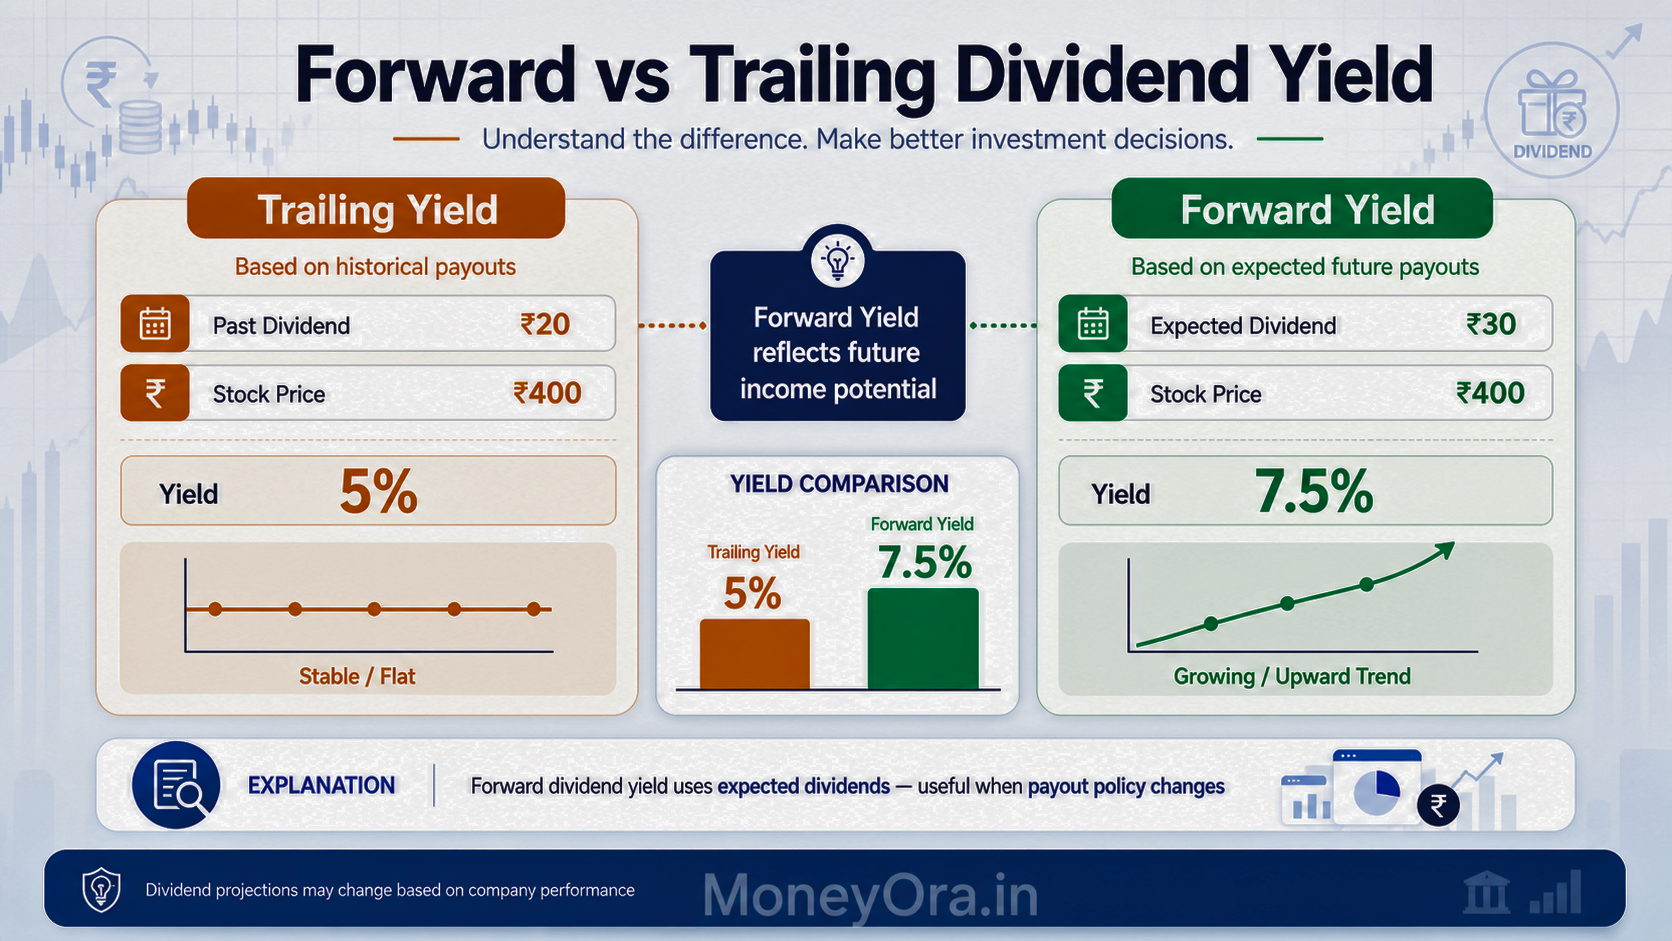
“Use forward dividend yield when companies change payout policies—it gives a more realistic picture of future income.”
Dividend yield calculator for Indian stocks
Indian dividend investing is heavily dominated by PSU companies — Coal India, Power Grid, NTPC, ONGC, NMDC — which tend to pay higher yields because the government relies on dividends as a revenue source from its majority-owned enterprises.
Private sector dividend stalwarts include ITC, Infosys, TCS, and HCL Tech. Banks like SBI and HDFC Bank pay dividends too, though RBI guidelines cap how much of net profit banks can distribute.
Typical dividend yields by sector in India
| Sector | Typical yield range | Notable stocks | Payout consistency |
|---|---|---|---|
| PSU energy / utilities | 4–9% | Coal India, NTPC, Power Grid | High (government-mandated) |
| PSU oil and gas | 3–8% | ONGC, GAIL, Oil India | Medium-high (commodity-dependent) |
| Metals and mining | 3–12% (variable) | Vedanta, NMDC, Hindustan Zinc | Variable (cyclical earnings) |
| IT / software | 1.5–3.5% | Infosys, TCS, HCL Tech | High (consistent free cash flow) |
| FMCG | 1–3% | ITC, HUL, Nestle India | High |
| Banking | 0.5–3.5% | SBI, HDFC Bank, Axis Bank | Medium (RBI-regulated) |
| Pharma | 0.5–2% | Sun Pharma, Dr. Reddy’s | Low-medium |
For stock analysis beyond yield — checking whether a high-dividend stock is also fairly valued — pair the dividend yield calculator with MoneyOra’s PE ratio calculator. A stock with 7% yield and PE of 5 is very different from one with 7% yield and PE of 40.
Vedanta dividend calculator and SBI dividend yield
Two of the most searched dividend topics in India — for very different reasons.
Vedanta dividend calculator
Vedanta has been one of the most aggressive dividend payers on Indian exchanges. In FY2023-24, Vedanta paid multiple interim dividends totalling Rs 45+ per share. At prices between Rs 250-450, this put Vedanta’s trailing yield between 10–18% at various points.
That’s a very high yield — and it came with serious risk. Vedanta Resources (the parent) carried high debt. Dividend payments were partly funded at the group level, not purely from Vedanta Ltd’s operating cash flows. This is a classic example where a very high dividend yield is a warning signal as much as an opportunity. The Vedanta dividend calculator simply divides total annual DPS by current Vedanta share price. What the calculator can’t tell you is whether that level of dividend is sustainable — that requires looking at the company’s free cash flow and debt separately.
To use the Vedanta dividend calculator: check NSE corporate actions for total dividends declared in the financial year (interim + final), note the current Vedanta price, and enter both into MoneyOra’s dividend yield calculator.
SBI dividend yield calculator
State Bank of India pays consistent dividends, and the yield typically ranges from 1.5–3.5% depending on the year and stock price. SBI’s dividend is also partly influenced by the government’s PSU dividend policy — as the majority owner, the government expects regular payouts. But RBI guidelines cap bank dividend payout ratios, which limits how high SBI’s yield can go regardless of profitability.
For the current SBI dividend yield: take the most recently declared annual dividend from NSE or SBI’s investor relations page, divide by the current SBI share price, multiply by 100. The Reserve Bank of India publishes updated guidelines on bank dividend distribution on its website — worth checking after each monetary policy cycle.
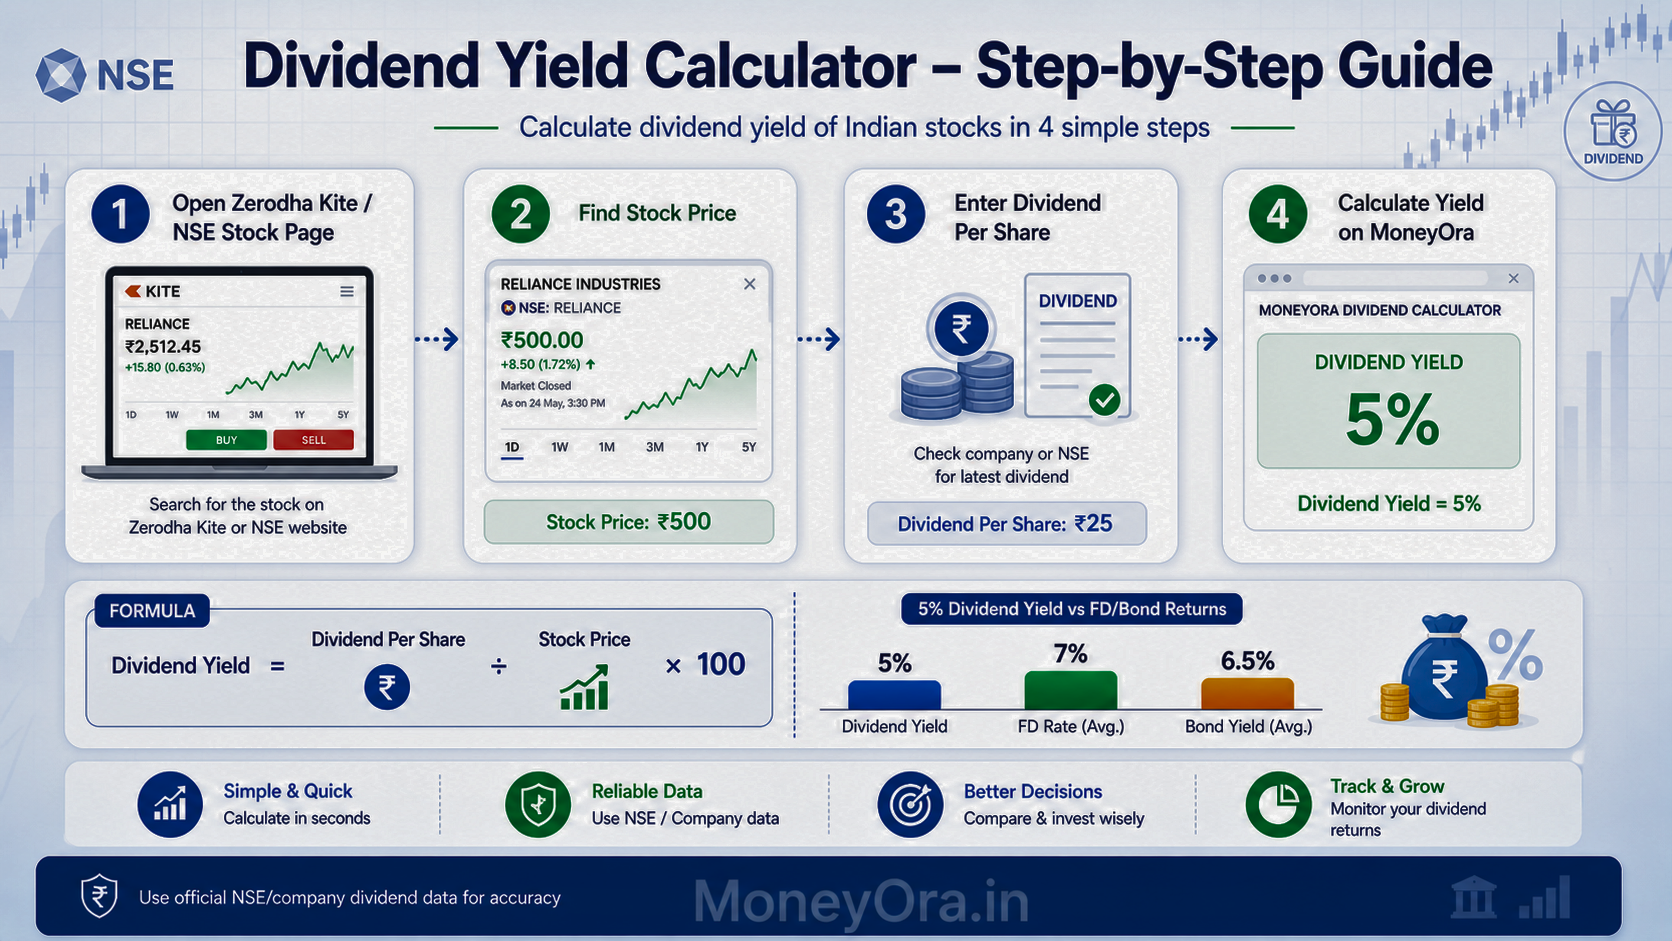
Dividend yield calculator for Zerodha investors
Zerodha Kite doesn’t have a built-in dividend yield calculator. Here’s the practical workflow.
Step 1: Find the annual DPS
On Kite, click “Fundamentals” on any stock — this shows last year’s DPS in many cases. For a precise figure, go to NSE’s corporate actions page and search the stock name. All dividend announcements appear with per-share amount and ex-dividend date.
Step 2: Note the current share price
This is the price shown in real-time on Kite. For a more stable yield estimate, some investors use the 52-week average price instead — this smooths out short-term price swings.
Step 3: Calculate on MoneyOra
Enter annual DPS and current price into MoneyOra’s dividend yield calculator. It returns the yield %, monthly income equivalent, and total annual income on your holding.
Step 4: Check the ex-dividend date
You must hold shares before the ex-dividend date to receive that payout. Buying on or after ex-date means waiting for the next payout — often 6–12 months away. Zerodha Kite’s “Events” tab shows upcoming ex-dividend dates for stocks in your watchlist.
SCHD, VOO, JEPQ, Coca-Cola — global dividend yield explained
Indian investors with access to US markets through LRS or GIFT City brokers are increasingly looking at global dividend ETFs and stocks. The dividend yield calculator works the same way — just substitute dollars for rupees and account for quarterly payment frequency.
SCHD dividend yield calculator
SCHD (Schwab US Dividend Equity ETF) holds 100 US stocks screened for strong dividend history, free cash flow, and return on equity. SCHD’s trailing yield has typically ranged from 3–4.5%, with quarterly distributions. SCHD dividend yield = annual distributions per unit / current unit price x 100. Check the latest quarterly distribution on Schwab’s website or on ETF databases like ETF.com, multiply by 4, then divide by current NAV.
VOO dividend yield calculator
VOO (Vanguard S&P 500 ETF) tracks the S&P 500 index. Its yield reflects the S&P 500’s aggregate dividend yield — typically 1.2–1.7%. Lower than SCHD because the S&P 500 includes many high-growth companies that pay small or no dividends.
JEPQ dividend yield calculator
JEPQ (JPMorgan Nasdaq Equity Premium Income ETF) generates income by selling call options on the Nasdaq 100 alongside holding stocks. Its stated yield is often 8–11% — but this income includes option premium, not pure dividend. The fund caps upside in exchange for current income. The dividend yield calculator works the same way — monthly distributions x 12 for annual DPS, divide by current price.
Coca-Cola dividend yield calculator
Coca-Cola (KO) has raised its dividend every year for 60+ consecutive years — a Dividend King. Its yield typically sits around 2.8–3.2%. The raw yield isn’t the appeal — the unbroken growth record is. The dividend yield with growth calculator is most useful for Coca-Cola, modelling what yield-on-cost becomes after 15–20 years of compounding growth at 5–7% annually.
S&P 500 dividend yield calculator
The S&P 500 dividend yield fluctuates daily. As of mid-2025, the trailing yield was approximately 1.3–1.5%. Current data is available on Multpl.com or from S&P Dow Jones Indices directly.
Portfolio dividend yield calculator
Owning one dividend stock is simple. Owning 10–15 is where a portfolio dividend yield calculator earns its keep. It aggregates yield across positions, weighted by investment amount.
Portfolio dividend yield formula
Portfolio Yield = (Total Annual Dividend Income / Total Portfolio Value) x 100
Example five-stock portfolio:
| Stock | Value invested | Dividend yield | Annual income |
|---|---|---|---|
| Coal India | Rs 2,00,000 | 6.5% | Rs 13,000 |
| Power Grid | Rs 1,50,000 | 4.3% | Rs 6,450 |
| Infosys | Rs 2,50,000 | 2.5% | Rs 6,250 |
| ITC | Rs 1,00,000 | 1.7% | Rs 1,700 |
| NTPC | Rs 1,00,000 | 3.8% | Rs 3,800 |
| Portfolio total | Rs 8,00,000 | — | Rs 31,200 |
Portfolio Yield = (Rs 31,200 / Rs 8,00,000) x 100 = 3.9%. Monthly equivalent = Rs 31,200 / 12 = Rs 2,600/month.
This portfolio yield compares directly with what an FD or RD would generate. Use MoneyOra’s RD calculator and FD calculator to see what Rs 8 lakh in bank instruments would yield after tax — then decide whether the equity upside potential justifies the volatility trade-off in your specific situation.
Dividend yield with growth calculator
This is where dividend investing gets genuinely interesting — and where most calculators fall short by showing only current yield.
You buy a stock at Rs 100 with a Rs 3 dividend. Initial yield = 3%. The company raises dividends 8% every year. After 10 years, the dividend is Rs 3 x (1.08)^10 = Rs 6.47 per share. Your purchase price is still Rs 100. Your yield-on-cost is now 6.47%.
The stock price probably went up too — but for an income investor, that’s secondary. The income from the same shares bought at Rs 100 is now 6.47% per year because the dividend grew. That’s yield-on-cost compounding — the real reward for holding quality dividend-growing companies for a long time.
Dividend yield with growth formula
Future DPS = Current DPS x (1 + Dividend Growth Rate)^Years
Future Yield on Cost = Future DPS / Purchase Price x 100
TCS, Infosys, and HCL Tech have historically grown dividends at 10–20% annually. For an investor who bought these at 2015 prices, the 10-year yield-on-cost is often 2–4x the initial yield. That’s the payoff for holding quality over chasing current high yields.
The CAGR calculator on MoneyOra calculates dividend growth rate across any two years — useful for projecting what a stock’s yield-on-cost becomes at year 5, 10, or 15.
Dividend tax in India — what you actually take home
This changed completely in the Union Budget 2020. Before April 2020, dividends were tax-free in the investor’s hands (companies paid Dividend Distribution Tax). From April 2020 onwards, dividends are taxable in the investor’s hands at their income tax slab rate.
How it works in 2025
- Dividends are added to total annual income
- Tax applies at your slab rate — 0%, 5%, 20%, or 30%
- If dividend from a single company exceeds Rs 5,000 in a financial year, TDS at 10% is deducted before payment
- Investors in nil or 5% tax slabs can claim a TDS refund when filing ITR
Post-tax dividend yield — real numbers
For a 30% tax bracket investor receiving a 6% pre-tax yield: Post-tax yield = 6% x (1 – 0.30) = 4.2%.
For a 5% tax bracket investor: Post-tax yield = 6% x (1 – 0.05) = 5.7%.
This matters for comparison. A 6% dividend stock for someone in the 30% bracket delivers only 4.2% post-tax — similar to a 7% FD taxed at 30% (which gives 4.9% post-tax). The dividend stock’s real advantage is capital appreciation potential and dividend growth, not the raw current yield.
The Income Tax India portal has updated TDS provisions under Section 194 for dividend income — check after each budget as rates and thresholds can change.
For retirement planning where dividends supplement pension, the NPS calculator, EPF calculator, and PPF calculator alongside the dividend yield calculator give the full income picture across all sources.
Common mistakes when using dividend yield
1. Chasing the highest yield
A 15% yield on a stock at a 52-week low is rarely a gift. It usually means earnings fell, the price crashed, and the dividend is next to be cut. After the cut, the price often falls further. You bought expecting 15%, end up with 5% yield plus a capital loss. This is the dividend trap, and it catches new investors regularly.
2. Not checking the payout ratio
High yield with high payout ratio is a yellow flag. A payout ratio above 100% means the company pays more in dividends than it earns — unsustainable. Payout ratios of 40–70% are generally healthy for established businesses. Always check this alongside the dividend yield calculator output.
3. Ignoring dividend history
A stock that cut its dividend twice in five years and is now offering a high yield deserves extra scrutiny. Consistency matters. 15 consecutive years of uninterrupted dividends — even at modest yield — almost always signals more reliable income than two years of very high payouts.
4. Buying just before ex-dividend date to “capture” the dividend
The share price typically drops by roughly the dividend amount on the ex-date. Buying one day before ex-date to collect the dividend doesn’t gain you anything — the price adjustment cancels it out. You need to have held shares for a meaningful period to genuinely benefit.
5. Not accounting for withholding tax on foreign stocks
For Indian investors holding US dividend stocks (Coca-Cola, SCHD, VOO) through the LRS route, a 25% withholding tax applies to dividends in the US. JEPQ’s stated 10% yield effectively delivers 7.5% after US withholding — the raw dividend yield calculator won’t show this automatically.
6. Using dividend yield as a sole investment screen
Dividend yield tells you income return at current price. It says nothing about earnings quality, balance sheet strength, or whether the dividend can be sustained. Always use yield alongside PE ratio, payout ratio, free cash flow, and dividend history. Use the PE ratio calculator together with dividend yield for a more complete picture.
Pro tips for dividend income investors
- Screen for payout ratio below 70% alongside yield. High yield with high payout ratio is a warning. High yield with low payout ratio is genuinely interesting.
- Look at 5–10 year dividend growth rate, not just current yield. A 2% yield growing 15% annually beats a 6% flat yield on a yield-on-cost basis within 8–9 years.
- Track ex-dividend dates in a calendar. Missing an ex-date by one day means waiting 6–12 months for the next payout from most Indian companies.
- Reinvest dividends during the accumulation phase. The SIP calculator and lumpsum calculator can model what reinvested dividends add to corpus over 15–20 years. It’s significant.
- For retirement income, pair dividend stocks with an SWP from a mutual fund. The SWP calculator models mutual fund withdrawals; the dividend yield calculator models stock income. Together they give the full picture.
- Check whether trading dividends is worth the transaction cost on small positions. The brokerage calculator shows exact costs per trade — making sure brokerage doesn’t erode small dividend amounts on positions you’re holding short-term.
- For stocks you’re building positions in over time at different prices, the stock average calculator shows your blended purchase price — important for accurate yield-on-cost calculation.
- Keep trading capital separate from dividend stock holdings. If you’re using margin on trading positions, the margin calculator ensures trading positions don’t inadvertently put long-term dividend holdings at risk.
Top Indian dividend stocks — yield comparison 2025
Yields change constantly with stock prices and dividend announcements. This table shows approximate ranges for well-known Indian dividend stocks. Always verify current data on NSE or BSE before investing.
| Stock | Sector | Approx. yield | Dividend frequency | 10-yr growth | Payout ratio |
|---|---|---|---|---|---|
| Coal India | Mining (PSU) | 5–8% | 2–3/year | Moderate | 80–100% |
| Power Grid | Power (PSU) | 3.5–5.5% | 2/year | Steady | 55–70% |
| NTPC | Power (PSU) | 2.5–4.5% | 2/year | Moderate | 40–55% |
| Vedanta | Metals | 6–18% (variable) | 3–5/year | Inconsistent | 80–150%+ |
| ITC | FMCG | 1.5–3.5% | 1/year | Strong (15%+/yr) | 70–85% |
| Infosys | IT | 1.5–3% | 2/year + special | Strong (20%+/yr) | 55–75% |
| TCS | IT | 1–2.5% | Quarterly + special | Very strong | 60–80% |
| SBI | Banking (PSU) | 1.5–3.5% | 1/year | Growing | 15–25% (RBI cap) |
| ONGC | Oil & gas (PSU) | 4–7% | 2/year | Moderate | 40–60% |
| Hindustan Zinc | Metals | 5–12% | 2–3/year | High but variable | 80–120% |
Vedanta and Hindustan Zinc yields above 10% need payout ratio scrutiny before acting on them. Coal India’s yield is more sustainably backed by steady earnings and government ownership. For total return beyond yield alone — including capital gains — use MoneyOra’s stock return calculator for any holding period.
How the dividend yield calculator fits your overall financial plan
Dividend stocks work best as one part of a wider strategy. For wealth building alongside dividend income, the SIP calculator models mutual fund corpus growth — growth from SIP, current income from dividends, these two complement each other well.
For investors carrying loans, the home loan EMI calculator, car loan EMI calculator, and personal loan EMI calculator show monthly debt commitments — making sure dividend income genuinely supplements finances rather than being offset by high-interest loan costs.
For retirement income planning, the SWP calculator models mutual fund withdrawal income alongside your dividend portfolio. The PPF calculator and EPF calculator add the guaranteed-return layer. Together, they give a three-source retirement income picture: EPF/PPF (safe), SWP (semi-market-linked), and dividend stocks (market-linked with income).
The IFSC code finder and bank details finder are utility tools that help when dividends land in your account and you need to verify bank details for reinvestment or transfer.
Conclusion
Dividend yield is a number that tells a story — but only if you read it in context. A 4% yield from Coal India and a 15% yield from a financially stressed small-cap are not the same opportunity. The dividend yield calculator gives you the percentage in seconds. The rest of this guide gives you the framework to interpret it correctly.
The three numbers worth running together every time: dividend yield (from the calculator), payout ratio (from company financials), and PE ratio (from MoneyOra’s PE tool). When a stock has a reasonable yield, a sustainable payout ratio below 70%, and a PE that isn’t inflated — that’s where dividend investing actually works consistently over time.
Use MoneyOra’s free dividend yield calculator to evaluate any stock — Indian or global. Enter annual DPS and current price, and you get yield %, monthly income, and annual income on your holding instantly. Pair it with the PE ratio calculator and SWP calculator to see the complete income investing picture.
Start building your dividend income plan today — free tools, instant results, no sign-up needed.
Frequently Asked Questions About Dividend Yield Calculator
A dividend yield calculator measures income return.
It calculates dividend as a percentage of price.
Formula = (Annual Dividend / Price) × 100.
It helps compare stocks and fixed income options.
Dividend Yield = (Annual DPS / Price) × 100.
Example: ₹20 dividend at ₹400 price.
Yield = 5%.
Calculator does this instantly.
2–5% is considered healthy.
Above 7% needs caution.
High yield may mean falling stock price.
PSU stocks often give higher yields.
DPS = Total Dividend / Total Shares.
In India: DPS = (Dividend % × Face Value) / 100.
Example: 500% on ₹2 face value = ₹10 DPS.
DPS is amount per share.
Dividend yield is percentage return.
DPS shows income value.
Yield shows return on investment.
Yes, dividends are taxable.
Tax is as per income slab.
TDS of 10% applies above ₹5,000.
No DDT applies now.
It uses expected future dividend.
Formula = (Expected DPS / Price) × 100.
Useful after dividend changes.
Gives forward-looking estimate.
Monthly Income = (Annual DPS × Shares) / 12.
Example: ₹20 DPS with 500 shares.
Monthly income ≈ ₹833.
Get DPS from NSE corporate actions.
Get current price from Zerodha Kite.
Enter both into calculator.
It shows yield and income instantly.
SBI yield is usually 1.5% to 3.5%.
Check latest dividend announcements.
Use current share price for accuracy.
Calculator gives exact current yield.