
Brokerage Calculator India: Every Charge on Your Stock Trade Explained
MoneyOra’s free Brokerage Calculator calculates the exact cost of every trade before you place it – brokerage, STT, exchange charges, SEBI fees, GST, stamp duty and net P&L. Works for equity delivery, intraday, and F&O. Enter your buy price, sell price, and quantity. The stock brokerage calculator breaks down every rupee you’ll pay.
Every trade in the Indian stock market comes with charges that most traders either ignore or underestimate. Brokerage is the obvious one, but by the time you add STT, GST, exchange transaction charges, and SEBI turnover fees, the total cost of a trade can look very different from what you expected. This brokerage calculator shows you the complete picture including the exact net P&L after all deductions so you know your real profit before you pull the trigger.
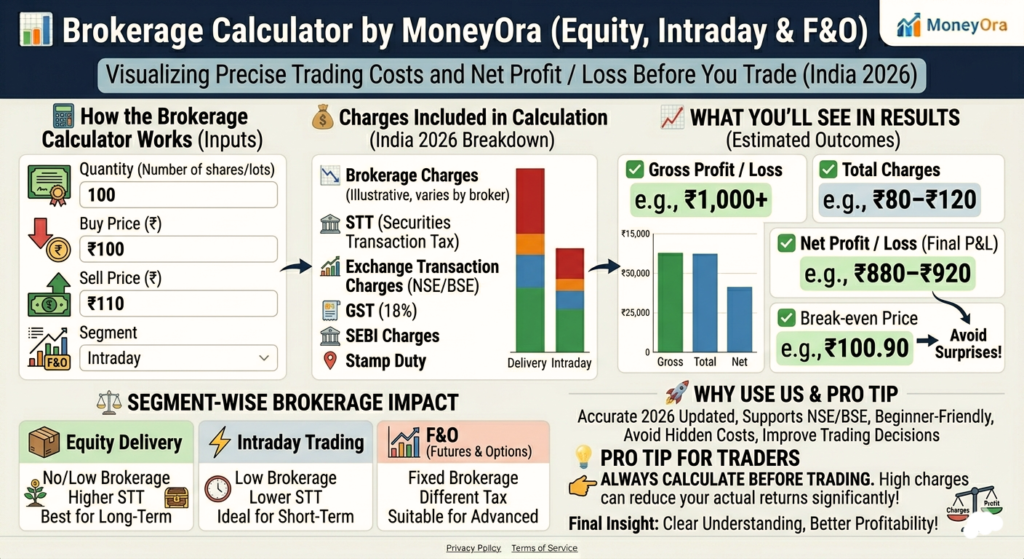
I know you want to know the cost of a stock trade. A brokerage calculator shows the cost before you execute it. Most Indian investors know that their broker charges brokerage. They are not clear about the full bill. The bill includes Securities Transaction Tax, GST exchange transaction charges SEBI turnover fees and stamp duty. These statutory charges often add up to more than the brokerage itself for delivery-based equity trades where discount brokers charge zero brokerage.
I think you will find this tool useful. This tool covers every trade type on Indian exchanges that are registered with SEBI. It includes equity delivery, equity intraday, futures, options and currency derivatives on NSE and BSE. Enter your trade value choose the segment and the tool will break out every charge in rupees. This way you know the cost before the order goes through.
I think this guide will help you. This guide covers all six components that the brokerage calculator computes. It also shows the formula with worked INR examples. It presents three scenarios that show where charges bite hardest. It explains the tax and framework that governs each charge for FY 2025-26. Finally it highlights four mistakes that Indian traders make by ignoring transaction costs.
Content gaps that most competing brokerage calculator pages miss entirely are addressed here.
These gaps include the break- price movement formula and the annual drag, on portfolio returns.
Both of these are covered in full here.
How to Calculate Brokerage Charges
Using MoneyOra’s brokerage charges calculator takes about 10 seconds:
- Select trade type: Equity Delivery, Equity Intraday, or F&O
- Select exchange: NSE or BSE charges vary slightly
- Enter quantity: Number of shares you’re buying/selling
- Enter buy price: Price per share at time of purchase
- Enter sell price: Price per share at time of sale
- For F&O: Also enter the lot size
The stock trading calculator instantly shows your total turnover, gross P&L, every charge broken down, and your actual net P&L after all costs. No submit button results update as you type.
What the brokerage calculator Why it matters
Every trade that gets executed in India has six mandatory cost components. The tool calculates all of them. Leaving out one gives you a wrong idea of your actual return.
The six charges are brokerage fee charged by your broker Securities Transaction Tax levied by the government under the STT Act exchange transaction charges levied by NSE or BSE SEBI turnover fees stamp duty levied by state governments and GST at 18 percent on brokerage plus exchange transaction charges. The brokerage calculator adds all six and shows you the cost for both buying and selling so you get a complete picture.
For a trader who makes 10 to 20 trades every month the total annual charges calculated by the brokerage calculator usually range from Rs 40,000 to Rs 1.5 lakh depending on the size of the trade the broker and the market segment. That amount if invested in a SIP with a 12 percent CAGR for 10 years would grow to Rs 6.98 lakh to Rs 26.18 lakh. The brokerage calculator makes the compounding cost of trading real and clear of just an idea.
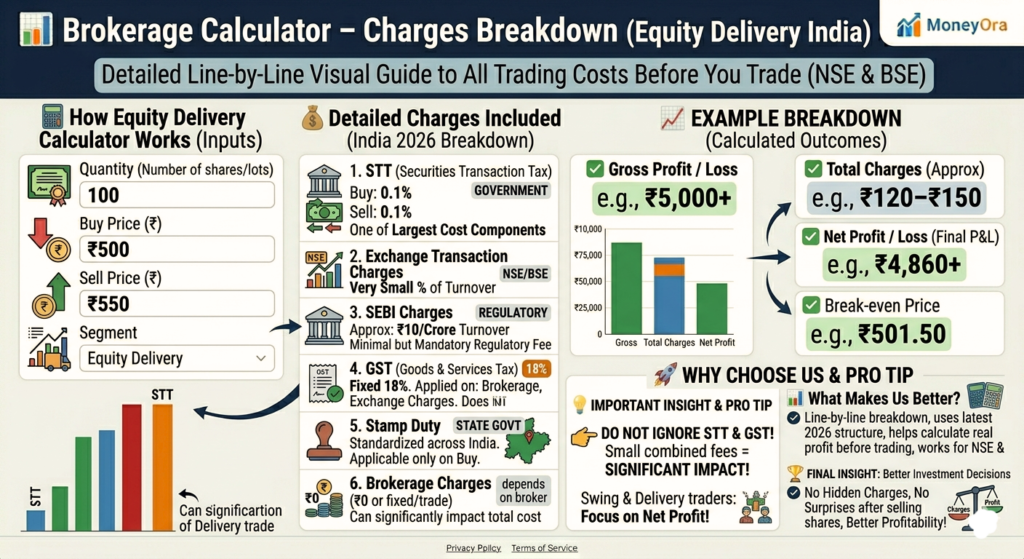
Brokerage calculator formula: every charge computed step by step
Each charge component uses a different formula. The rates below are current for FY 2025-26 and FY 2026-27 as published by NSE India, the Ministry of Finance, and SEBI.
Brokerage Calculator: Equity Delivery Trade All Charge Formulas
Brokerage (discount broker) = Rs 0 on delivery OR Rs 20 per order flat
STT = 0.1% of trade value on both buy and sell sides
Exchange TXN charge = 0.00322% of trade value (NSE equity)
SEBI turnover fee = 0.0001% of trade value
Stamp duty = 0.015% of trade value on buy side only
GST = 18% of (Brokerage + Exchange TXN charge)
Total charges = Sum of all six components
All percentages apply to trade value which equals price per share multiplied by number of shares
STT is the largest single charge component on equity delivery trades
Stamp duty applies on buy side only per the Indian Stamp Act amendment effective 2020
GST applies on brokerage and exchange charges only not on STT or stamp duty
SEBI fee revised to Rs 10 per crore of turnover in 2023
Worked example: Rs 50,000 equity delivery trade on NSE (Zerodha)
You buy 100 shares of HDFC Bank at Rs 500 per share. Trade value is Rs 50,000.
Brokerage Calculator: Step-by-Step for Rs 50,000 Delivery Buy Trade
Brokerage (Zerodha delivery) = Rs 0
STT on buy = 0.1% of Rs 50,000 = Rs 50
Exchange TXN charge = 0.00322% of Rs 50,000 = Rs 1.61
SEBI turnover fee = 0.0001% of Rs 50,000 = Rs 0.05
Stamp duty on buy = 0.015% of Rs 50,000 = Rs 7.50
GST = 18% of (Rs 0 + Rs 1.61) = Rs 0.29
Total buy-side charges = Rs 59.45
When you sell all 100 shares later at Rs 550 (trade value Rs 55,000)
STT on sell = 0.1% of Rs 55,000 = Rs 55
Exchange + SEBI + GST on sell side = approximately Rs 1.98
No stamp duty on sell side
Total sell-side charges = Rs 56.98
Total round-trip charges = Rs 59.45 + Rs 56.98 = Rs 116.43
Gross profit at Rs 550 sell price = Rs 5,000
Net profit after all charges = Rs 5,000 minus Rs 116.43 = Rs 4,883.57
Effective charge on gross profit = 2.33 percent
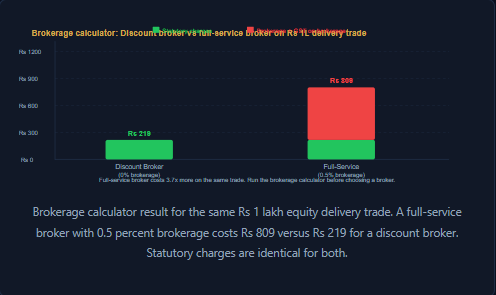
That 2.33 percent friction on a Rs 5,000 gain is entirely from statutory charges on a zero-brokerage broker. With a full-service broker charging 0.5 percent brokerage each way the same trade would cost an additional Rs 500 in brokerage plus GST on that brokerage making total charges over Rs 616 or 12.3 percent of the gross profit. That contrast is immediate and undeniable.
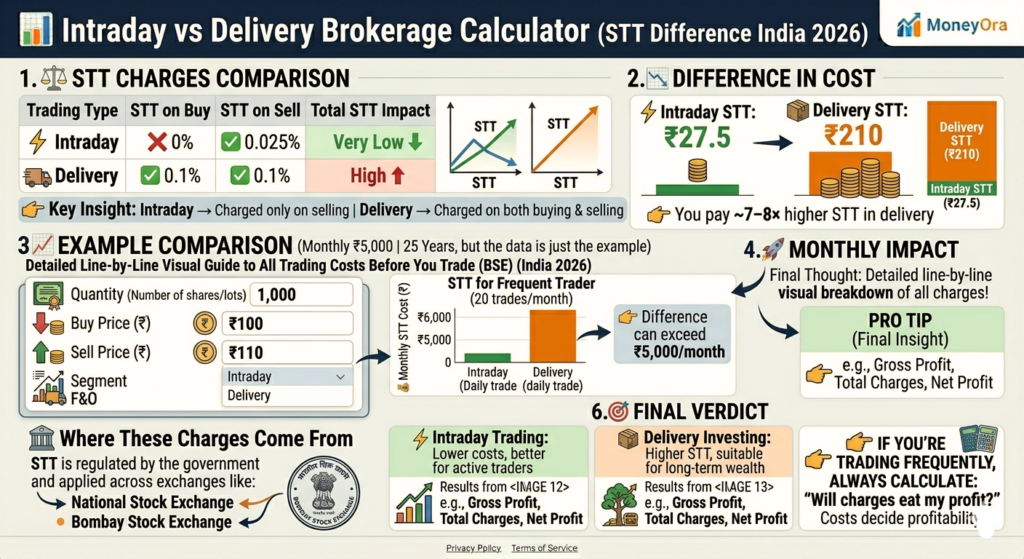
Intraday vs Delivery Brokerage What’s the Difference?
The intraday brokerage calculator and delivery brokerage calculator use different charge structures. Here’s the key difference:
| Charge | Equity Delivery | Equity Intraday |
|---|---|---|
| Brokerage | 0.1% or ₹20/order (lower of the two) | 0.03% or ₹20/order (lower of the two) |
| STT | 0.1% on buy + sell | 0.025% on sell side only |
| Stamp duty | 0.015% on buy value | 0.003% on buy value |
| Exchange charges | 0.00297% of turnover | 0.00297% of turnover |
| SEBI fees | 0.0001% of turnover | 0.0001% of turnover |
| GST | 18% on brokerage + exchange | 18% on brokerage + exchange |
| DP charge (sell) | ₹18.25 + GST per scrip | Not applicable |
Intraday trades cost less per trade because STT is lower and there’s no DP charge. But intraday traders make more trades so the total cost over a month can be significantly higher than a long-term delivery investor. Use the intraday trading calculator to model your per-trade cost and multiply by how many trades you make monthly.
F&O Brokerage Calculation India
The F&O brokerage calculator works differently from equity because F&O trades involve lot sizes and the STT structure is different.
- Brokerage: Flat ₹20 per order (most discount brokers)
- STT: 0.0125% of sell-side premium value (options); 0.02% on sell-side notional value (futures)
- Exchange charges: 0.00188% for options (NSE)
- SEBI fees: 0.0001% of turnover
- GST: 18% on brokerage + exchange charges
- Stamp duty: 0.002% on buy-side value
Enter your lot size in MoneyOra’s options brokerage calculator and the calculator accounts for the lot multiplier automatically. For active F&O traders, even the flat ₹20/order brokerage adds up quickly – 50 trades/month is ₹2,000 in brokerage alone, before regulatory charges.
Practical scenarios and comparison tables
Scenario A: Brokerage calculator for delivery, intraday, and F&O trades
The brokerage calculator produces very different outputs depending on trade segment. Most investors only know their delivery charges but intraday and F&O have different STT rates, different exchange charges, and different brokerage structures. The table below models Rs 1 lakh of trade value across all three segments on a discount broker like Zerodha or Groww.
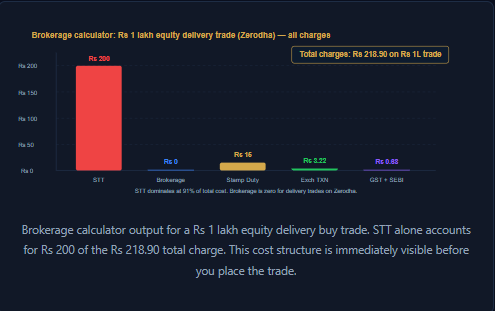
Brokerage calculator: Rs 1 lakh trade value across segments (discount broker)
| Charge | Equity Delivery | Equity Intraday | Options (sell) |
|---|---|---|---|
| Brokerage | Rs 0 | Rs 20 per order | Rs 20 per order |
| STT (buy + sell) | Rs 200 | Rs 25 (sell only) | Rs 100 on premium (sell) |
| Exchange TXN (NSE) | Rs 3.22 | Rs 3.22 | Rs 50 (0.05% on premium) |
| SEBI fee | Rs 0.10 | Rs 0.10 | Rs 0.10 |
| Stamp duty (buy) | Rs 15.00 | Rs 3.75 | Rs 3.00 |
| GST (18%) | Rs 0.58 | Rs 4.18 | Rs 12.60 |
| Total charges | Rs 218.90 | Rs 56.25 | Rs 185.70 |
| As % of trade value | 0.22% | 0.056% | 0.19% |
STT rates for FY 2025-26 per the Finance Act. Options figures are illustrative for a Rs 1 lakh premium value. Actual F&O charges depend on lot size and premium. Use the tool for exact per-trade figures.
Scenario B: Break-even price movement using the brokerage calculator
This is the content gap that no competing brokerage calculator page covers. The most actionable output of any brokerage calculator is not the total charge in rupees but the minimum stock price movement needed just to break even on the trade. If the stock does not move enough to cover charges, the trade is a guaranteed loss even if the direction was right.
For Rs 1L delivery trade with Rs 218.90 buy-side charges and Rs 219.88 sell-side charges:
Round-trip charges = Rs 438.78
Break-even move = (438.78 / 1,00,000) x 100 = 0.44%
- The stock must rise at least 0.44 percent just to recover trading costs
- For intraday trades: break-even is much lower at around 0.06 to 0.08 percent
- For a full-service broker at 0.5% brokerage: break-even rises to approximately 1.6 percent
- Know your minimum move requirement before entry
Brokerage calculator: break-even move across broker types and trade sizes
| Trade size | Discount broker (delivery) | Full-service broker (0.5%) | Intraday (discount) |
|---|---|---|---|
| Rs 10,000 | 0.44% | 2.57% | 0.24% |
| Rs 50,000 | 0.44% | 1.65% | 0.10% |
| Rs 1,00,000 | 0.44% | 1.22% | 0.07% |
| Rs 5,00,000 | 0.44% | 1.04% | 0.05% |
Break-even percentages include all charges on both buy and sell sides. Delivery break-even is constant at 0.44% because statutory charges scale linearly with trade value. Full-service broker break-even falls with trade size because brokerage is capped at certain thresholds.
Scenario C: Annual cost of trading computed by the brokerage calculator
The brokerage calculator is most sobering when you run it annually across your full trading activity. Active traders rarely compute their cumulative annual charges. The table below models three investor profiles.
Brokerage calculator: estimated annual trading costs by investor type
| Investor profile | Monthly trades | Avg trade size | Annual charges | That amount at 12% CAGR over 10 years |
|---|---|---|---|---|
| Casual delivery investor | 2 trades/month | Rs 50,000 | Rs 2,634 | Rs 8,167 |
| Active intraday trader | 20 trades/day | Rs 50,000 | Rs 1,08,000 | Rs 3,35,090 |
| F&O trader | 10 trades/day | Rs 1,00,000 | Rs 55,800 | Rs 1,73,024 |
Annual charges estimated using the brokerage calculator at discount broker rates. The “10-year opportunity cost” column uses the lumpsum calculator at 12 percent CAGR to show what those charges could have grown into if invested instead.
An active intraday trader paying Rs 1.08 lakh per year in charges is giving up Rs 3.35 lakh of compounding potential over 10 years on charges alone, before accounting for any trading losses on the underlying positions. Use it before every trade, not just once for reference.
Taxation and legal framework governing trading charges in India
Every trading charge that the brokerage calculator computes has a specific legal basis. Knowing which authority sets each rate helps investors verify whether trading charges are correct and claim deductions at tax time. I find this clarity useful.
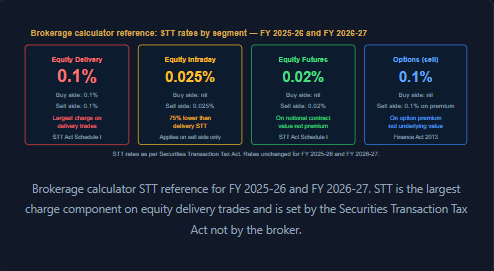
Securities Transaction Tax
STT is a central government tax under the Securities Transaction Tax Act 2004. Stock exchanges collect STT when a trade is executed and send it to the government. STT paid on equity delivery trades is not deductible as a business expense if equity gains are treated as capital gains. If equity trading is declared as business income STT becomes deductible as a business expense under Section 36(1)(xv) of the Income Tax Act according to the Income Tax India portal. I find this rule useful.
GST on brokerage and exchange charges
GST at 18 percent is added to brokerage fees and exchange transaction charges under the GST Act, which is administered by the Central Board of Indirect Taxes and Customs. GST does not apply to STT or stamp duty because those are levies. Traders who are GST‑registered which is required when brokerage‑eligible income exceeds Rs 20 lakh per year may receive input GST credit on brokerage and exchange charges if trading is treated as business income. I see that this can reduce costs for traders.
Stamp duty
Stamp duty on securities transactions became standardised across the country from July 1 2020 under the Indian Stamp (Collection of Stamp Duty through Stock Exchanges, Clearing Corporations and Depositories) Rules 2019. Before this reform rates were different in each state. The current unified rate is 0.015 percent for delivery buys and 0.003 percent for intraday. F&o buys and these rates apply in every state. I find it helpful that the rates are the same
Trading charges and income tax treatment
Claiming trading charges as deductions depends on how trading activity’s classified. If equity gains are treated as capital gains only the direct cost of acquisition and transfer can be deducted. Brokerage charges and STT are not deductible under the capital gains route. If trading is declared as business income all six charge components calculated by the brokerage calculator become expenses under Section 28 and Section 37 of the Income Tax Act. For traders this classification decision has significant tax implications and it is worth discussing with a chartered accountant before each financial year. I think it is smart to review this with a tax professional.
SEBI fee note SEBI changed its turnover‑based fee structure in October 2023 to Rs 10 per crore of turnover which’s 0.0001 percent for all market segments. This fee is the component in any brokerage calculator calculation and is paid by the exchange, to SEBI as a regulatory levy. Investors cannot opt out of this fee. Negotiate it with their broker. I see that this fee is fixed and non‑negotiable.
Common mistakes to avoid when using a brokerage calculator
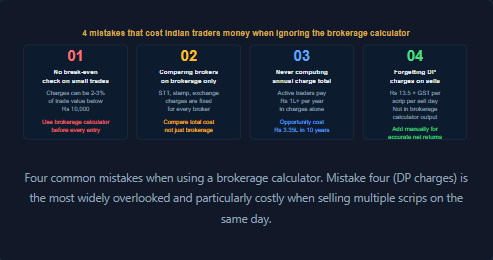
Not running the brokerage calculator before entry on trades
For trades below Rs 10,000 on a full‑service broker the brokerage calculator often shows that charges are more than 2 to 3 percent of the trade value. A stock must move 3 percent just to cover the cost of the trade before any profit appears. Most retail investors placing orders after reading tips or seeing posts on social media never run the brokerage calculator. Run the numbers first. If the break‑even move is than 1 percent for a delivery trade or more than 0.2 percent for an intraday trade the trade economics are not favorable.. Increase the position size so that fixed charges are spread out or skip the trade altogether.
Comparing brokers on brokerage alone without using a brokerage calculator
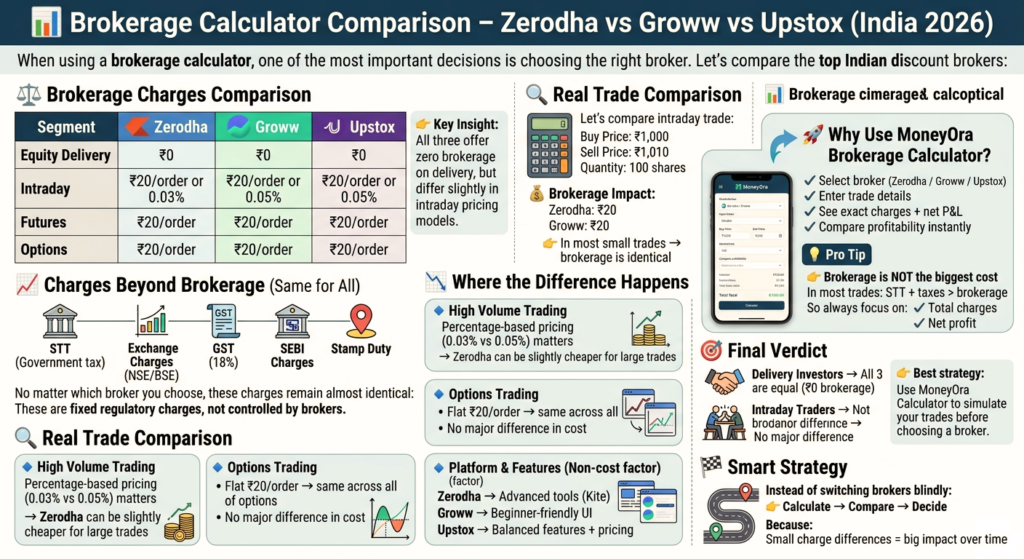
Many investors choose a broker based on the advertised brokerage rate not realizing that statutory charges (STT, stamp duty, exchange charges, SEBI fee, GST) are the same for every broker. For a Rs 1 lakh delivery trade on any discount broker statutory charges total Rs 218.90 whether you use Zerodha, Groww, Angel One or any other SEBI‑registered broker. The broker only controls the brokerage fee itself. For delivery trades most major discount brokers now charge zero making the total cost essentially the same across platforms for that segment.
Using the brokerage calculator for individual trades and never for annual totals
The most powerful use of the brokerage calculator is to compute cumulative annual charges across all trades. Active intraday traders and F&O traders who try the brokerage calculator for the time are often surprised to find that their annual charge bill equals or exceeds their annual trading profit. The brokerage calculator lets you model totals. Once you have that number check the SIP calculator to see what that same annual amount would grow to if it were invested in an equity fund. That comparison is the way to decide if high‑frequency trading is worth the friction cost for your situation.
Forgetting DP charges which the brokerage calculator does not include
Depository Participant charges apply whenever you sell shares from your demat account. Zerodha charges Rs 13.5 plus GST per scrip per day of a sell transaction. If you sell shares in five companies on the same day that is five separate DP charges totaling Rs 80.73 including GST. These DP charges are levied by your depository participant through NSDL or CDSL. Are separate from the exchange charges the brokerage calculator computes. Always add DP charges manually when computing returns, on delivery sell trades especially when selling multiple scrips in a single day.
These are the questions Indian stock market investors ask most often about the brokerage calculator and trading charges in India.
What charges does a brokerage calculator include for Indian stock trades?
Frequently Asked Questions About Brokerage Calculator
A brokerage calculator is a free online tool.
It calculates all charges in a stock market trade.
This includes brokerage, STT, exchange charges, SEBI fees, GST, and stamp duty.
It also shows your net profit or loss after deductions.
MoneyOra's stock brokerage calculator covers equity delivery, intraday, and F&O.
It works for both NSE and BSE trades.
Brokerage is calculated using this formula.
Number of shares × Price per share × Brokerage rate.
Discount brokers usually cap brokerage at ₹20 per order.
If percentage exceeds ₹20, you pay ₹20.
If it is lower, you pay the percentage amount.
Both buy and sell sides are charged separately.
Use the brokerage charges calculator to calculate total cost.
STT stands for Securities Transaction Tax.
It is charged by the central government.
It applies to every securities transaction in India.
For delivery trades, STT is 0.1% on both buy and sell.
For intraday, it is 0.025% on sell side.
For options, it is 0.0125% on sell premium.
STT is often the largest charge in delivery trades.
The brokerage calculator includes STT automatically.
SEBI turnover fee is a regulatory charge.
It is ₹10 per crore of turnover.
This equals 0.0001%.
It is very small per trade.
Usually just a few paisa.
It applies to all market participants.
The share brokerage calculator includes this charge.
Discount brokers charge zero brokerage on delivery trades.
They charge ₹20 per order on intraday and F&O.
Examples include Zerodha, Groww, Upstox, and Angel One.
Full-service brokers charge 0.25%–0.5% of trade value.
Examples include ICICI Direct, HDFC Securities, and Kotak Securities.
The cost difference can be very high on large trades.
Intraday brokerage follows this formula.
min(0.03% × trade value, ₹20) per order.
Multiply by 2 for buy and sell.
Add STT (0.025% on sell).
Add exchange charges (0.00297%).
Add SEBI fees (0.0001%).
Add GST (18% on brokerage + exchange).
Add stamp duty (0.003% on buy).
The intraday brokerage calculator applies all automatically.
For equity delivery, yes.
Zerodha charges zero brokerage on delivery trades.
For intraday and F&O, it charges ₹20 per order.
Zero brokerage does not mean zero charges.
STT, exchange charges, SEBI fees, GST, and stamp duty still apply.
These charges are fixed by regulators.
Use the brokerage calculator to see full cost.
Three main factors affect brokerage.
First is buy and sell price.
Higher price means higher brokerage.
Second is quantity or volume.
More shares increase total charges.
Third is type of broker.
Discount brokers charge flat fees.
Full-service brokers charge percentage fees.
Trade type also affects taxes and charges.