
Position Size
Calculator
Optimal trade size for Stocks, F&O & Crypto — based on your capital and stop-loss.
Shares = (Capital × Risk%) ÷ (Buy − SL)Invest = Shares × Buy PriceMax Loss = Shares × (Buy − SL)| Risk % | Shares | Investment | Max Loss | % of Capital |
|---|
Position Size Calculator: 7 Best Ways to Limit Trading Risk
Every trader who has lost serious money in the markets will tell you the same thing: the loss wasn’t from a bad stock pick or a wrong forex call. It was from trading too large. A position size calculator is the tool that tells you exactly how many shares, lots, or units to trade so that one bad trade cannot destroy your account. “brokerage charges affect your breakeven — understand the full cost before sizing trades”
Whether you trade Nifty futures on Zerodha, EURUSD or XAUUSD on MT5, Bitcoin on a crypto exchange, or equities on NSE, the math behind position sizing is identical. You enter your account balance, how much you’re willing to lose on this trade, and your stop loss distance — and the calculator returns the correct position size. No guessing. No overtrading.
This guide covers position sizing for every major market: forex, crypto (BTC, BTCUSD), gold (XAUUSD), indices, stocks, and futures. Use MoneyOra’s free position size calculator alongside this guide to run your own numbers.
What is position sizing and why does it matter?
Position sizing answers one question: how much of this trade should I take?
Most beginners answer that question based on how confident they feel, or based on how much their broker allows with margin. Both are wrong. Confidence has nothing to do with whether a trade will work — markets move on information you don’t have. And maximum margin is not a trading strategy; it’s an invitation to blow up your account.
Position sizing answers the question mathematically, starting from how much money you can afford to lose. You decide that upfront — say, 1% of your ₹2,00,000 trading account = ₹2,000 maximum loss on any trade. Then the calculator works backwards from your stop loss to tell you exactly how many shares or lots that ₹2,000 of risk translates into at current prices.
Here’s why this matters more than most traders realise. If you risk 10% per trade and have 5 losses in a row — which happens even to good traders — you’ve lost 41% of your account. Recovery from a 41% drawdown requires a 70% gain just to break even. That’s brutal and slow. If you risk 1% per trade, 5 consecutive losses cost you only 4.9% of your account. You can recover that in days.
The Securities and Exchange Board of India (SEBI) has published investor education materials that specifically recommend using position sizing and stop-loss orders as primary risk controls for retail traders in equity derivatives. Position sizing isn’t an advanced concept — it’s basic financial discipline.
Position size calculator formula — the math explained
The core formula is the same across all markets. Only the units change.
Universal position size formula
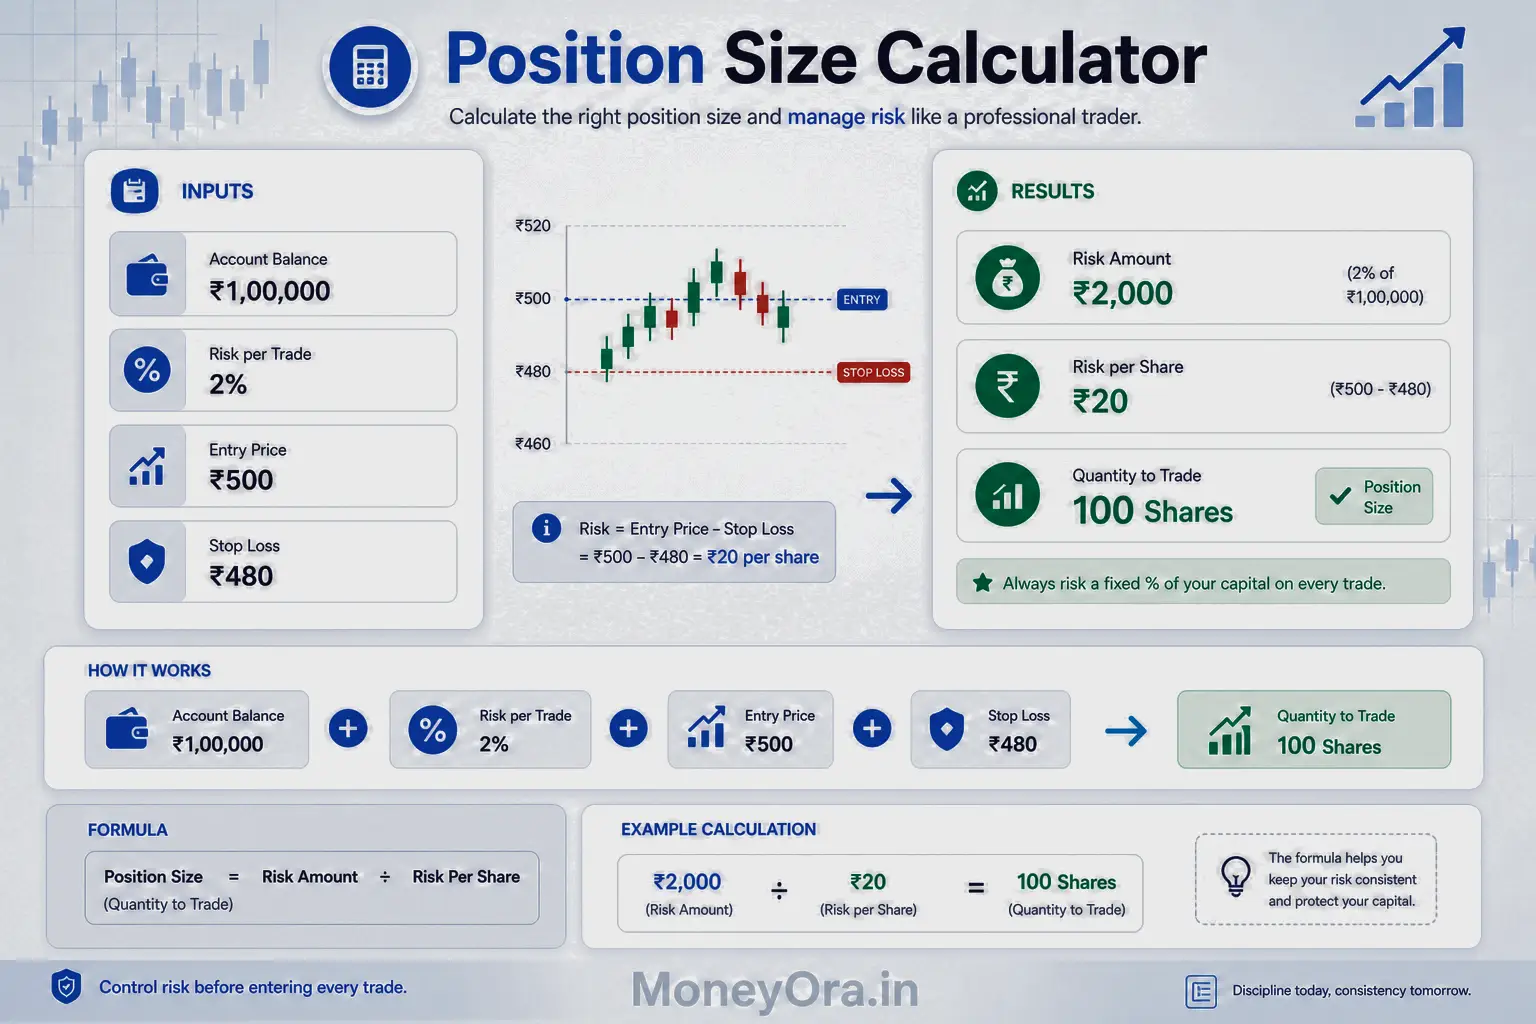
Risk Amount = Account Balance × Risk %
Stop Distance = Entry Price − Stop Loss Price
Position Size = Risk Amount ÷ Stop Distance
That’s the whole thing. Three lines. Let’s put numbers to it.
Account: ₹2,00,000. Risk: 1% = ₹2,000. Entry: ₹500. Stop loss: ₹480. Stop distance: ₹20.
Position Size = ₹2,000 ÷ ₹20 = 100 shares.
If the trade stops out at ₹480, you lose 100 × ₹20 = ₹2,000 exactly. That’s your planned loss — no surprises.
For short trades (selling first), the formula is the same but the stop distance flips: Stop Distance = Stop Loss Price − Entry Price.
What changes between markets
For stocks and crypto, the formula above works directly because one unit = one share or one coin. For forex and futures, there’s a pip value or contract multiplier involved. We’ll cover each market separately in the sections below.
Once you have the position size, cross-check it with the margin calculator to confirm you have enough margin in your account before placing the trade. Running out of margin mid-trade is avoidable — always check both numbers.
The 1% and 2% risk rule in trading
The 1% risk rule is simple: never put more than 1% of your account at risk on any single trade. On a ₹1,00,000 account, that’s ₹1,000 per trade. On a ₹10,00,000 account, it’s ₹10,000.
Many retail traders in India use the 2% rule instead, especially in intraday and F&O trading where high-probability setups justify a slightly larger risk. There’s no universal right answer — the choice depends on your strategy’s win rate and reward-to-risk ratio.
How risk % affects account survival
Here’s what 10 consecutive losing trades looks like at different risk levels:
| Risk per trade | Account after 5 losses | Account after 10 losses | Recovery needed |
|---|---|---|---|
| 1% | 95.1% remaining | 90.4% remaining | ~10.6% |
| 2% | 90.4% remaining | 81.7% remaining | ~22.4% |
| 5% | 77.4% remaining | 59.9% remaining | ~67% |
| 10% | 59% remaining | 34.9% remaining | ~187% |
| 20% | 32.8% remaining | 10.7% remaining | ~835% |
Ten losing trades isn’t unusual. Any strategy with a 50% win rate will produce runs of 10 or more consecutive losses roughly once every 1,024 trades. Most active traders take 500–2,000 trades per year. This will happen to you. Position sizing determines whether that run kills your account or just costs you a bad week.
For the stop loss placement that drives position size calculations, the stop loss calculator on MoneyOra helps you find the right exit level before entering any trade.
Position size calculator for forex (EURUSD, GBPUSD)
Forex position sizing uses the same three-line formula, but introduces pip value — the dollar (or rupee) value of each pip move per lot.
Standard pip values (for 1 standard lot)
| Currency pair | Pip size | Pip value per standard lot |
|---|---|---|
| EURUSD | 0.0001 | $10 |
| GBPUSD | 0.0001 | $10 |
| USDJPY | 0.01 | ~$9.09 |
| USDCAD | 0.0001 | ~$7.70 |
| AUDUSD | 0.0001 | $10 |
Forex position size calculator formula
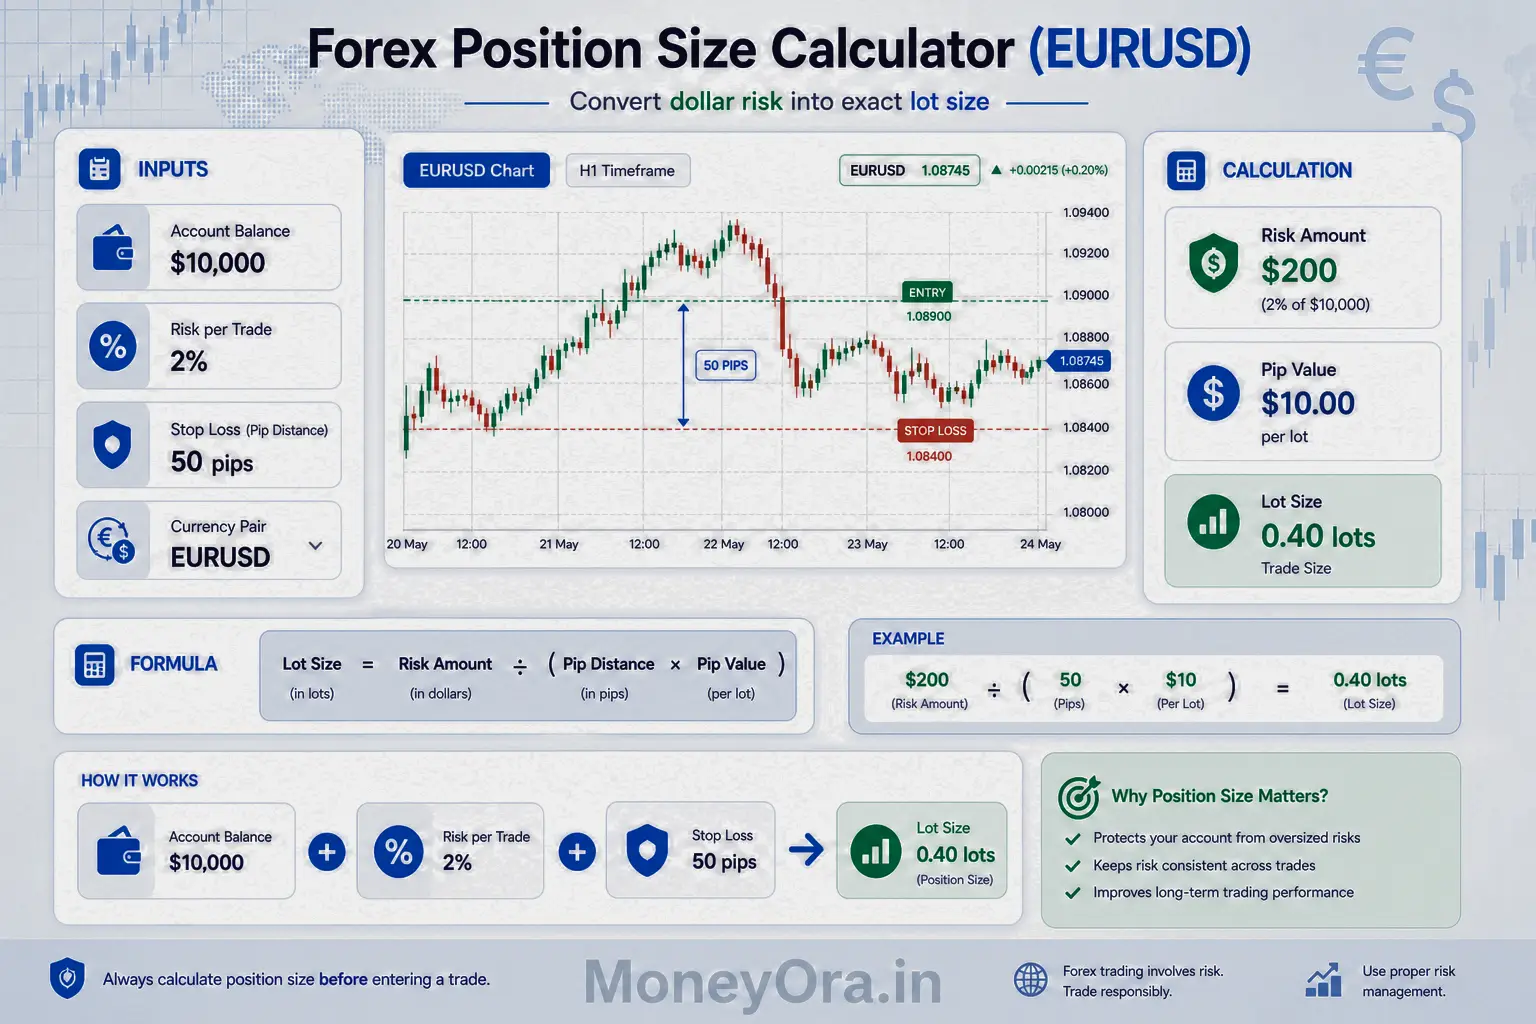
Lots = (Account Balance × Risk%) ÷ (Stop Loss in pips × Pip Value per lot)
Worked example — EURUSD
- Account: $10,000
- Risk: 1% = $100
- Entry: 1.0850, Stop Loss: 1.0830 (20-pip stop)
- Pip value (EURUSD, standard lot): $10
- Lots = $100 ÷ (20 × $10) = $100 ÷ $200 = 0.5 lots
This is a mini lot — exactly 50,000 units. If EURUSD falls 20 pips to 1.0830, you lose exactly $100. That’s your 1% risk, protected by position sizing.
The forex position size calculator on MoneyOra handles pip value conversion automatically for all major currency pairs. You don’t need to memorise pip values — just enter your account currency, pair, risk %, and stop distance in pips.
For traders based in India using INR accounts on forex-adjacent platforms, use the position size calculator with your account balance in INR and it converts to lot size directly.
Position size calculator for XAUUSD (gold)
XAUUSD (gold vs US dollar) is one of the most traded instruments in India among retail forex traders using MT4 and MT5 platforms. Gold’s volatility makes position sizing especially important — a 1% move in gold at standard lot size can mean $1,000 of profit or loss.
XAUUSD contract specifications
- 1 standard lot XAUUSD = 100 troy ounces of gold
- 1 mini lot = 10 oz
- 1 micro lot = 1 oz
- Pip = $0.01 move in gold price
- Pip value per standard lot = $1
Gold position size calculator example
- Account: $5,000
- Risk: 1% = $50
- Gold entry: $2,350, stop loss: $2,320 (300-pip stop = $30 move)
- Pip value (standard lot, XAUUSD): $1
- Lots = $50 ÷ (300 × $1) = $50 ÷ $300 = 0.17 lots (approximately 1 mini lot + 7 micro lots)
Gold can move $20–$50 in a single day. A 300-pip ($3) stop on gold is actually quite tight for an intraday trade. If you’re holding overnight, a 500–1,000 pip stop is more realistic, which reduces your position size further.
According to Wikipedia’s article on gold as an investment, gold prices can move 15–20% during periods of financial stress — the 2020 COVID crisis saw gold move from $1,450 to $2,075 in six months. Without position sizing, a single large gold position during such a move can wipe out an undercapitalised account quickly.
Always use the XAUUSD position size calculator before entering any gold trade. The tool does the oz, pip, and lot conversion automatically.
Position size calculator for crypto (BTC, BTCUSD)
Crypto position sizing follows the same formula as stocks, because crypto is priced per unit rather than in pips. The complication is volatility — Bitcoin can move 5–10% in a single day, which means even a small BTC position can produce large dollar swings.
BTC position size calculator example
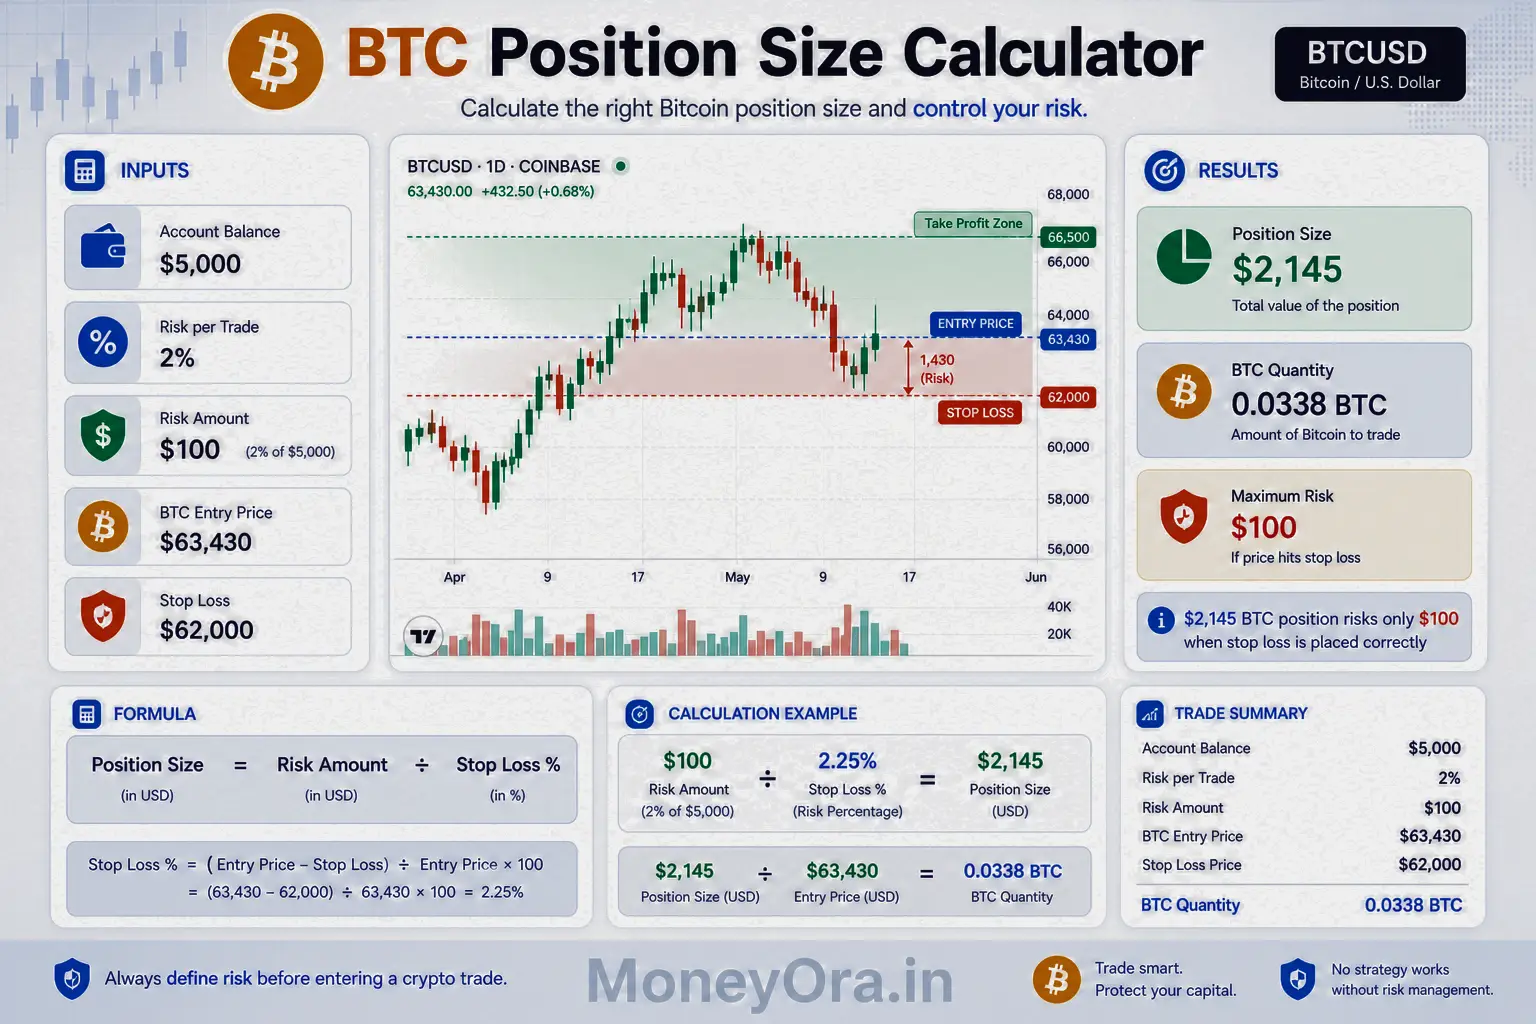
- Account: $5,000
- Risk: 2% = $100
- BTC entry: $65,000, stop loss: $62,000 (stop distance: $3,000)
- Position Size = $100 ÷ $3,000 = 0.033 BTC
At $65,000 per BTC, 0.033 BTC = $2,145 of total exposure. Your account balance is $5,000 — so you’re using about 43% of your capital in this one BTC trade. That’s the key insight: position size controls risk, not total capital deployed. You can have a large notional position and still risk only 2% if your stop is calibrated correctly.
Crypto position sizing considerations
Crypto exchanges often allow you to trade with leverage — 3x, 5x, 10x, even 100x on some platforms. The position size calculator must account for leverage. If you’re using 5x leverage, your effective account balance for risk calculation is still your actual capital — not the leveraged amount. Risk 2% of $5,000 = $100 loss maximum, regardless of leverage used.
For altcoins with smaller market caps, use wider stops (ATR-based), which will reduce position size further. The crypto stop loss calculator paired with the position size calculator gives you both numbers for any altcoin trade.
Position size calculator for stocks (India — Zerodha, Groww)
For Indian equity traders on Zerodha, Groww, Upstox, or ICICI Direct, the position size calculator works directly in rupees. No pip conversion needed.
Position size calculator India — stock example
- Account: ₹5,00,000
- Risk per trade: 1% = ₹5,000
- Stock: Infosys
- Entry price: ₹1,500
- Stop loss: ₹1,462 (ATR-based, 38-point stop)
- Position Size = ₹5,000 ÷ ₹38 = 131 shares
Total investment = 131 × ₹1,500 = ₹1,96,500 — about 39% of the account. You’re not “risking” ₹1.96 lakh. You’re risking only ₹5,000. The rest is still yours as long as you exit at the stop.
Position size calculator Zerodha — practical steps
- Check your Zerodha account balance in Console
- Decide risk % (start with 1%)
- Use the ATR from Kite’s charts to set your stop distance
- Enter all four numbers in MoneyOra’s position size calculator
- Check the resulting share quantity against your available margin using the margin calculator
- Place a limit buy order for exactly that quantity
Position size calculator Groww
Groww doesn’t have a native position size tool. Use MoneyOra’s calculator before placing any order. The calculation is the same — account balance, risk %, entry, stop loss. The position size output is the share quantity to enter in Groww’s order screen.
For investors who also buy stocks for dividends (not just trading), the dividend calculator and PE ratio calculator on MoneyOra help evaluate whether the fundamentals justify the position alongside the risk-based sizing.
Position size calculator for futures and indices (Nifty, Bank Nifty)
Futures trading in India requires one extra step: accounting for the lot size. Each Nifty futures contract covers 25 index units. Each Bank Nifty contract covers 15 units. You can’t buy fractions of a lot, so position size rounds down to the nearest whole number of lots.
Position size calculator for Nifty futures
- Account: ₹10,00,000
- Risk per trade: 1% = ₹10,000
- Nifty entry: 22,500, stop loss: 22,350 (150-point stop)
- Nifty lot size: 25 units
- Risk per lot = 150 points × 25 = ₹3,750
- Number of lots = ₹10,000 ÷ ₹3,750 = 2.67 → round down to 2 lots
Trading 2 Nifty lots with this stop risks exactly ₹7,500 (2 × ₹3,750), which is below the ₹10,000 limit. That’s fine — stay below, not above, your risk limit.
Bank Nifty futures position sizing
- Account: ₹10,00,000
- Risk: 1% = ₹10,000
- Entry: 47,000, stop: 46,700 (300-point stop)
- Lot size: 15 units
- Risk per lot = 300 × 15 = ₹4,500
- Lots = ₹10,000 ÷ ₹4,500 = 2.22 → round down to 2 lots
The brokerage calculator is essential alongside position sizing for futures trades. Zerodha charges ₹20/order for futures, but exchange charges, STT, and GST add up. On a 2-lot Nifty trade, total transaction costs can run ₹300–400 per side. Factor this into your risk calculation — your actual risk is position loss + transaction costs.
Position size calculator for MT5 — how it works
MetaTrader 5 (MT5) is the most widely used trading platform for forex, gold, indices, and CFDs among Indian traders who access international markets. MT5 has a built-in position size function, but it requires manual calculation or a custom EA (Expert Advisor). Many traders use external tools — like MoneyOra’s position size calculator — instead.
How to use position size calculator with MT5
- Open your MT5 account and check the balance in the terminal
- Identify your entry price and stop loss price on the chart
- Check the pip value for your instrument (MT5 shows this in the Trade tab)
- Enter: account balance, risk %, entry price, stop loss, and pip value into MoneyOra’s position size calculator MT5
- Take the lot size output and enter it directly in MT5’s order window
MT5 position size for common instruments
| Instrument | Standard lot | Pip size | Pip value (1 lot) | Typical daily range |
|---|---|---|---|---|
| EURUSD | 100,000 units | 0.0001 | $10 | 60–120 pips |
| XAUUSD (Gold) | 100 oz | $0.01 | $1 | 1,500–4,000 pips |
| BTCUSD | 1 BTC | $1 | $1 | $500–$3,000 |
| US30 (Dow Jones) | 1 contract | 1 point | $1–$10 (broker-dependent) | 200–500 points |
| NAS100 | 1 contract | 1 point | $1–$10 | 100–400 points |
Position size calculator MT5 usage also matters for myfxbook and babypips users. The myfxbook position size calculator and babypips position size calculator are popular tools abroad — but MoneyOra’s calculator gives the same output and works in both USD and INR, making it more useful for Indian traders who need to think in rupees.
Lot size vs position size — what’s the difference?
These terms confuse almost every beginner. Here’s the clear distinction.
Position size is the total trade exposure — how many units of an asset you’re buying or selling. In stocks, it’s in shares. In crypto, it’s in BTC or ETH. In forex, it’s in units of base currency.
Lot size is the standardised trading unit in forex and derivatives markets. Rather than saying “I’m buying 50,000 units of EURUSD,” traders say “I’m buying 0.5 lots.” Same thing — different expression.
| Lot type | Forex units | Gold (oz) | Approx margin needed (1:100) |
|---|---|---|---|
| Standard lot (1.0) | 100,000 | 100 | ~$1,000 |
| Mini lot (0.1) | 10,000 | 10 | ~$100 |
| Micro lot (0.01) | 1,000 | 1 | ~$10 |
| Nano lot (0.001) | 100 | 0.1 | ~$1 |
For Indian traders using the position lot size calculator, the output is given in lots for forex/gold and in shares/units for stocks and crypto. The calculator automatically uses the right unit for each market type.
Common mistakes in position sizing
These errors show up repeatedly in trading accounts across every market and experience level.
1. Calculating position size after deciding how much to buy
Many traders look at a stock they like, decide they want 500 shares, then check if the potential loss is “acceptable.” That’s backwards. Start with your maximum acceptable loss, then let the formula tell you the quantity. Feelings about a specific share count have no place in the calculation.
2. Ignoring the stop loss in position sizing
If you don’t have a stop loss, the position size formula doesn’t work — because stop distance is a required input. Trading without a stop loss is the same as planning to risk your entire position. Always set the stop first, then calculate size. The stop loss calculator helps you set the level before you calculate how much to trade.
3. Using total account as risk amount
A trader with ₹5,00,000 thinks “I’ll risk ₹50,000 on this trade — only 10% of my account.” That’s not the 1% rule. Risk is the money lost if the stop gets hit, which is position size × stop distance. Always calculate risk as Account Balance × Risk%, not as a gut feel.
4. Not adjusting for open positions
If you have three trades already open and each is risking 1%, you’re at 3% portfolio risk. Your actual free capital for the next trade should be calculated on the remaining unrisked account, not the total balance. Many traders blow up not from one bad trade but from five simultaneous bad positions they didn’t notice were correlated.
5. Trading maximum margin instead of calculated size
Intraday margin on NSE allows 5–10x leverage. If your broker shows you can buy 500 shares, it doesn’t mean you should. The margin requirement and your position size limit are completely unrelated. One is what your broker allows; the other is what your risk management allows. Always use your risk-calculated size, not your maximum allowed size.
6. Skipping position sizing on “obvious” trades
High-confidence trades feel different — and they’re just as dangerous because of that feeling. The market doesn’t know how confident you are. Every trade gets the same position sizing discipline, regardless of how clear the setup looks.
Pro tips for consistent position sizing
- Set your risk % once, in writing, and don’t change it mid-session. 1% for beginners, 2% for experienced traders with a tested edge. Raising it on a whim because a trade “looks good” defeats the purpose of having a rule.
- Always calculate both position size AND stop loss before market open. Never enter a trade without both numbers ready. Use MoneyOra’s position size calculator and stop loss calculator together for every trade.
- Check the reward-to-risk ratio before entering. If your stop is 30 points but your target is only 20 points, the trade has a negative expectancy regardless of win rate. A 2:1 reward-to-risk ratio is the practical minimum. The stop loss calculator on MoneyOra lets you set both levels and view the ratio.
- Treat all markets the same. The position size calculator for forex, crypto, gold, and stocks uses the same three-line formula. Resist the temptation to “trade bigger” in crypto just because it moves more. Larger moves mean wider stops, which means smaller position sizes — the math keeps your risk constant.
- Log every trade with the position size and actual outcome. After 50–100 trades, review: are your stops too tight (stopping out before the trade works)? Are your targets realistic? Data from your own trade log beats any generic advice.
- For long-term savings alongside active trading, keep the two accounts separate. Use the SIP calculator and SWP calculator to model your investment corpus independently. Trading capital should be money you can afford to lose — not your SIP savings or retirement fund.
- Check whether trading profits are going toward debt repayment or wealth building. The EMI calculator helps you see how much your loan commitments cost monthly, and whether clearing high-interest debt is a better use of capital than additional trading positions.
Position sizing across markets — comparison table
Before using the position size calculator for a new market, this table shows what inputs and units apply.
| Market | Stop distance unit | Position size unit | Pip/Point value | Leverage available (typical) | Typical risk % used |
|---|---|---|---|---|---|
| Forex (EURUSD, GBPUSD) | Pips (0.0001) | Lots (standard/mini/micro) | $10 per pip (1 std lot) | Up to 1:500 | 1–2% |
| XAUUSD (gold) | Pips ($0.01) | Lots (oz based) | $1 per pip (1 std lot) | Up to 1:200 | 1–2% |
| BTCUSD (crypto) | Price ($) | BTC units | $1 per $1 move | 1x–20x (exchange dependent) | 1–2% |
| NSE stocks (India) | Price (₹) | Shares | ₹1 per ₹1 move per share | 1x (delivery), 5–10x (intraday) | 1–2% |
| Nifty futures | Index points | Lots (25 units each) | ₹25 per point (1 lot) | ~5–8x (SEBI regulated) | 1% |
| Bank Nifty futures | Index points | Lots (15 units each) | ₹15 per point (1 lot) | ~5–8x | 1% |
| Indices CFD (MT5) | Points | Lots (broker-defined) | $1–$10 per point | Up to 1:200 | 1–2% |
How position sizing connects to your full financial plan
Position sizing is about protecting trading capital. But your trading account is usually just one part of your total finances. The rest — savings, investments, loans — all benefit from the same disciplined approach.
For retirement and long-term wealth, the SIP calculator, PPF calculator, NPS calculator, and EPF calculator on MoneyOra give you a picture of how your non-trading wealth is building.
For lump-sum investment returns, the lumpsum calculator and CAGR calculator show compound growth over time — the slow, steady alternative to active trading.
If you’re also managing loans, keeping trading capital and debt repayment separate is essential. The home loan EMI calculator, car loan EMI calculator, and personal loan EMI calculator show exactly what your monthly debt commitments are — critical context for deciding how much capital to allocate to active trading versus safe investments like FDs or RDs.
For evaluating individual stocks before sizing a position, the stock return calculator, stock average calculator, and option price calculator help with the analytical side before the risk management side kicks in.
For banking needs — verifying account details before transferring trading profits — MoneyOra’s IFSC code finder and bank details finder are quick reference tools that save time.
Conclusion
Most trading losses aren’t from picking wrong assets. They’re from trading the wrong size. One position too large can erase weeks of disciplined gains in a single bad session. The position size calculator removes that variable completely — you never need to guess how much to trade.
The formula is three lines. The inputs are four numbers. The output is one clear quantity. There’s no reason to trade without it.
Whether you’re sizing a Nifty futures trade on Zerodha, a XAUUSD position on MT5, a BTC trade on a crypto exchange, or just buying Indian stocks on Groww — the math is identical. Account balance, risk %, entry, stop loss. Repeat for every trade, without exception.
Use MoneyOra’s free position size calculator now. It handles stocks, forex, crypto, gold, futures, and indices — with instant results in both INR and USD. Pair it with the stop loss calculator and margin calculator to complete your trade setup before placing any order.
Know your size before you trade. Protect your capital. Calculate now — free on MoneyOra.
Frequently Asked Questions About Position Size Calculator
A position size calculator helps control risk.
It tells how many shares or units to trade.
You enter account balance and risk %.
You also enter entry price and stop loss.
It returns the correct quantity.
This keeps losses within limits.
Lots = (Account Balance × Risk%) ÷ (Stop Loss × Pip Value).
Example: $10,000 account with 1% risk.
Risk = $100.
20 pip stop with $10 pip value.
Position = 0.5 lots.
Risk amount = 1% of account.
Position size = Risk ÷ stop distance.
Example: ₹2,00,000 account.
Risk = ₹2,000.
Stop = ₹20.
Position = 100 shares.
Risk = Account × Risk%.
Stop distance = Entry − Stop Loss.
Position = Risk ÷ stop distance.
Example: $5,000 account, 2% risk.
BTC position ≈ 0.033 BTC.
1 standard lot = 100 oz.
Pip value = $1 per pip.
Use calculator with risk and stop.
For small accounts use micro lots.
0.01 lot = small exposure.
Never risk more than 1–2% per trade.
₹1,00,000 account → ₹1,000–₹2,000 risk.
This protects capital.
It allows multiple losing trades.
It keeps you in the market long-term.
Zerodha does not have built-in tool.
Use external calculator.
Enter balance, risk %, entry, stop loss.
It gives number of shares.
Check margin before placing trade.
Yes, it works for indices.
Nifty lot size = 25.
Risk per lot = Stop distance × 25.
Lots = Risk ÷ risk per lot.
Always round down.
Position size = total quantity.
Lot size = fixed contract unit.
Example: Nifty lot = 25.
Position size tells how many lots to trade.
Position sizing is part of risk management.
Risk management includes stop loss and limits.
It also includes diversification.
Position sizing answers how much to trade.