
SIP vs FD article you have read until now compares the two over a calm, uneventful 10 or 15 years. Nice steady line going up. 12% here, 7% there. SIP wins, case closed. Article ends.
That is not the moment people actually ask this question. People ask SIP vs FD when the Sensex has just fallen 1,400 points in a single session, their mutual fund app is showing red, and their FD-holding relative is smugly reminding them “I told you so.” The real question is not which one wins on a calm chart. It is what happens to your money when the market falls 30%, 40%, even 60% — and whether you can actually stay invested long enough for the math to work in your favour.
This article answers that exact question using real Indian market crashes — 2008, 2020, and 2025 — not theoretical projections. You will see what SIP investors who kept investing through the crash actually earned, what FD holders earned over the same period, and the one behavioural fact that determines almost everyone’s actual outcome more than any return rate does. Model your own numbers with MoneyOra’s
SIP calculator and FD calculator as you read.
For investors who continue their SIP through a market crash and hold for 5+ years, SIP historically outperforms FD because falling NAVs let you buy more mutual fund units at lower prices — a mechanic called rupee cost averaging. FD returns stay fixed and predictable regardless of the crash, making it safer for short-term goals, but it produces meaningfully lower long-term wealth than a SIP that is not stopped during the downturn.
Why “SIP vs FD” Suddenly Matters the Moment Markets Crash
Nobody panics about SIP vs FD when the market is quietly grinding higher. The question gets emotional, urgent, and genuinely difficult only when your portfolio value drops and the FD next door has not moved an inch. That asymmetry — one option visibly bleeding, the other looking calm — is exactly when bad decisions get made.
The honest starting point is this: a crash does not change what SIP and FD fundamentally are. SIP remains a market-linked instrument whose value fluctuates with the market. FD remains a fixed-return instrument whose value does not. What a crash does is test your actual behaviour against your stated investment horizon — and that gap, more than the return rate, decides what you end up with.
What Happens to SIP When Markets Crash?
Here’s the thing about SIP that most people misunderstand: a market crash doesn’t hurt your SIP the way it hurts a lumpsum investment. It can actually help it.
When markets fall, the NAV of your mutual fund drops. Your monthly SIP buys more units at that lower NAV. This is rupee cost averaging — not a marketing term, just math. The same ₹5,000 that bought you 50 units at NAV ₹100 will buy you 100 units if the NAV drops to ₹50.
Here’s a quick illustration:
| Month | NAV (₹) | SIP Amount (₹) | Units Purchased |
|---|---|---|---|
| Jan | 100 | 5,000 | 50.00 |
| Feb (crash) | 70 | 5,000 | 71.43 |
| Mar (deep) | 55 | 5,000 | 90.91 |
| Apr (recovery begins) | 75 | 5,000 | 66.67 |
| May | 95 | 5,000 | 52.63 |
| Total | ₹25,000 | 331.64 units |
Average cost per unit: ₹75.40 — even though NAV hit ₹55 at the bottom.
If you had stopped your SIP in February and restarted in May, you would have missed the three cheapest months. Your average cost would be ₹97.50 instead of ₹75.40. That difference compounds over ten years into a meaningful gap.
This is why “pause your SIP during a crash” is usually terrible advice.
What SIP does not do: It does not prevent your portfolio value from falling in the short term. During a crash, your SIP portfolio will show red. That’s unavoidable. The mechanism only works if you stay invested long enough to see the recovery
SIP vs FD — Historical Crash Comparison
Let’s stop theorising and look at what actually happened during India’s four major market corrections.
2008 — The Global Financial Crisis
Nifty 50 fell from ~6,300 (Jan 2008) to ~2,600 (Oct 2008). A 59% drop in nine months.
| Scenario | Amount Invested | Outcome by Dec 2010 |
|---|---|---|
| ₹5,000/month SIP (continued through crash) | ₹36,000 over 24 months | ~₹48,000+ (Nifty recovered to 6,000+ by late 2010) |
| ₹5,000/month SIP (paused Oct–Mar, restarted Apr 2009) | ₹24,000 invested | Missed the cheapest months; lower unit accumulation |
| ₹1,00,000 FD at 9% (Dec 2007) for 2 years | ₹1,00,000 | ~₹1,18,000 pre-tax (but FD rates fell to 6% by 2009) |
The SIP investor who stayed invested through the crash and recovery came out materially better by 2012 than the one who paused — despite identical monthly contributions.
2011 — The Eurozone Scare
Nifty fell from ~5,900 (Jan 2011) to ~4,600 (Dec 2011). About 22%.
A more contained correction. SIPs that continued through 2011 recovered by mid-2012. FD rates were relatively high (8%–9%) during this period, so FD wasn’t a bad choice — but post-tax returns at 30% bracket still came to roughly 5.6%–6.3%.
2015–16 — China Slowdown + Global Selloff
Nifty fell from ~9,100 (Feb 2015) to ~6,800 (Feb 2016). About 25%.
SIPs that continued accumulated cheap units through this period. Recovery came by late 2017. Investors who stayed the course saw XIRR of 13%–15% on their 5-year SIP by 2019. FD rates at the time were around 7%–7.5%, translating to 4.9%–5.25% post-tax at 30%.
2020 — COVID Crash (India’s Fastest Ever)
Nifty dropped from ~12,000 (Feb 2020) to ~7,600 (March 24, 2020). A 37% fall in five weeks.
| Metric | SIP (continued) | FD (opened at crash) |
|---|---|---|
| Entry period | Feb–May 2020 | March–April 2020 |
| Rate/Return | Market-linked | ~5.1%–5.5% (SBI FD rate at the time) |
| Post-tax at 30% bracket | Subject to 12.5% LTCG after 1 year | ~3.57%–3.85% net |
| By December 2021 | Nifty at 17,000+ — SIP XIRR above 30% for that period | FD matured at booked rate |
The COVID crash was unusual — recovery was the fastest in Indian market history. But that’s exactly the point: you don’t know when recovery happens. The SIP investor who stayed invested from February 2020 onward bought units at ₹7,600 level. That compounded sharply.
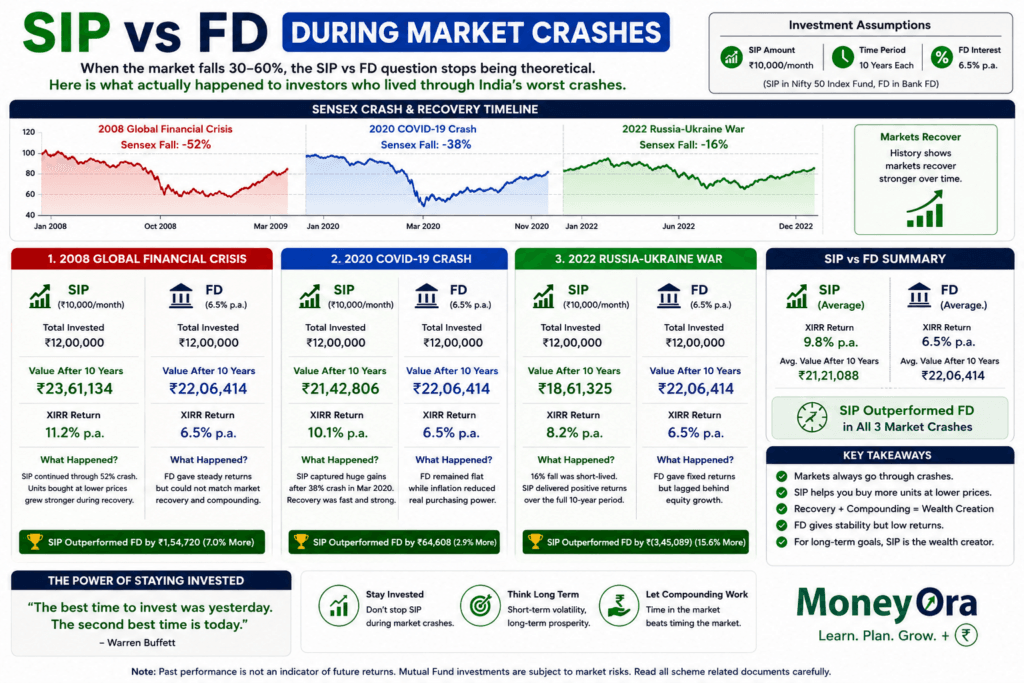
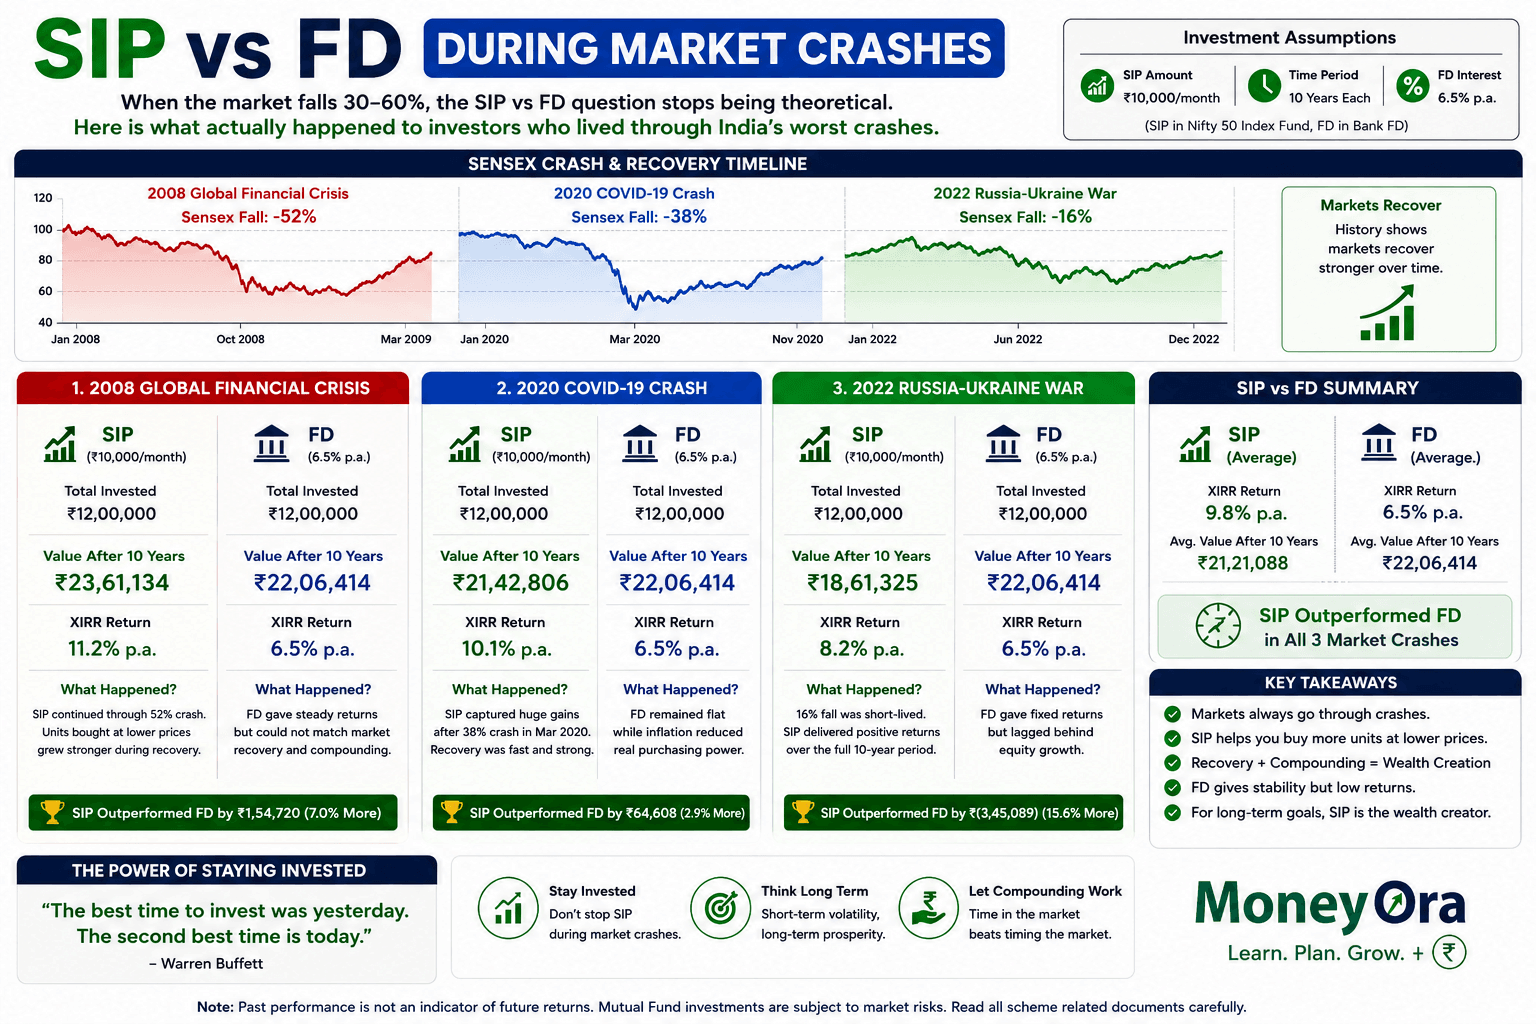
2008 Financial Crisis: What SIP and FD Investors Actually Earned
The 2008 global financial crisis remains India’s most brutal stock market crash by depth. The Sensex dropped 1,408 points to 17,605 in early January 2008, then fell another 875 points the next day, with an intraday plunge of 2,273 points. By October 2008, the index had crashed to around 8,701 — a decline of over 60% from its January peak.
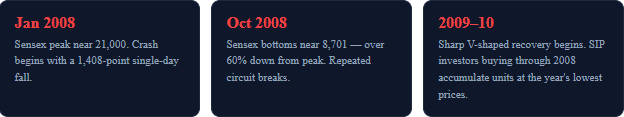
An investor who started a SIP in January 2008 — right before the worst of the crash — and kept investing monthly through the entire 60%+ decline was, on paper, sitting on heavy losses by October 2008. An FD investor who locked in a 5-year deposit the same month was earning a steady, unaffected interest rate throughout.
But the SIP investor was quietly buying units at NAVs that had fallen by more than half. When the market recovered through 2009 and beyond, those crash-period units were the single biggest contributor to the SIP investor’s eventual outperformance. The FD investor’s outcome never changed — they got exactly the rate they locked in, no more, no less. The SIP investor’s outcome depended entirely on one decision: did they keep investing, or did they stop.
2020 COVID Crash: The Fastest Fall and Fastest Recovery
The COVID-19 crash was different from 2008. It happened fast. The Sensex fell from around 41,000 in January 2020 to 25,981 by March 2020. This was a drop of about 37%. It all happened in two months. In 2008 it took a year for a similar drop.
On 23 March 2020 the Sensex fell sharply. It went down by 3,934 points, which’s 13.15%. The Nifty also collapsed. It fell by 1,135 points, which’s 12.98% to 7,610. This was one of the single-day falls in Indian market history.
Many investors were worried. They saw that their 10-year Nifty SIP was only showing 2.3% returns. Their 14-year SIP was only showing 5%. These numbers looked alarming. Some investors panicked. They stopped their SIP. Redeemed all their money.
What Actually Happened Next: By November 2020 the Sensex had recovered. It climbed back to around 41,000. This was just eight months after the March low. Investors who stopped their SIP in March and April 2020 missed the months. They missed the months when NAVs were at their lowest. Investors who kept investing through March, April and May 2020 bought units at low prices.
An investor with a Fixed Deposit (FD) did not lose any money. They earned the interest rate they had locked in. They were not affected by the 37% crash. They were also not affected by the 58%+ rally that followed. The FDs feature. That it does not move. Was helpful during the panic.. It was not helpful, during the recovery.
2025 Tariff Selloff: The Latest Test
On 7 April 2025 Indian stock markets had a bad day. The Sensex fell 3,939.68 points or 5.22% to 71,425.01. The Nifty 50 dropped 1,160.8 points or 5.06% to 21,743.65. This happened because of US tariff hikes and Chinas 34% tariff on US imports. All 30 Sensex stocks fell, some by much as 12%.
There was also a decline from September 2024 to March 2025. The Sensex fell 11.79% or over 10,000 points. The Nifty fell around 13%. This was due to election uncertainty, weak company earnings and sustained foreign investor outflows. Over ₹11 lakh crore in market value was lost in one volatile session.
The pattern from 2008 and 2020 repeated itself. SIP investors who kept investing during the September 2024–March 2025 decline bought units at lower prices. FD investors earned their fixed rate no matter what the news said.
The tariff selloff and its impact on the market was significant. The selloff was a test, for investors.
Investors saw losses. The market had a time. The Sensex and Nifty had falls.
The tariff hikes and retaliatory tariffs affected the market.
The investors who kept investing during the decline benefited. They bought at prices.
The FD investors got their fixed returns.
Why Crashes Are Actually Good for SIP. Let Us Look At The Math
Quick Definition: Rupee Cost Averaging
Rupee cost averaging is when you put a fixed amount of money into something at times no matter what the price is. So you end up buying units when the prices are low and fewer units when the prices are high. When the market crashes this really works out well for you because the same amount of money you invest every month can buy a lot units than it could when the market is calm or going up.
This is the part that a lot of comparisons, between SIP vs FD do not talk about. Let us go through an example to see how it works.
Worked Example: ₹10,000 Monthly SIP Through a Simulated Crash
| Month | Market Condition | NAV (₹) | Units Bought |
|---|---|---|---|
| Month 1 | Pre-crash, normal | 50 | 200.00 |
| Month 2 | Crash begins (−20%) | 40 | 250.00 |
| Month 3 | Crash deepens (−40%) | 30 | 333.33 |
| Month 4 | Crash bottom (−50%) | 25 | 400.00 |
| Month 5 | Early recovery | 32 | 312.50 |
| Month 6 | Continued recovery | 42 | 238.10 |
| Total Invested | — | ₹60,000 | 1,733.93 units |
Compare this to an investor who invested the same ₹60,000 as a lump sum at the Month 1 NAV of ₹50 — they would have received exactly 1,200 units. The investor who continued their SIP through the crash ended up with 1,733.93 units for the same total money — 44% more units, purely because of buying through the dip.
If the NAV eventually recovers to ₹55 (above the pre-crash level), the lump-sum investor’s 1,200 units are worth ₹66,000. The SIP-through-the-crash investor’s 1,733.93 units are worth ₹95,366 — a dramatically better outcome, entirely explained by accumulating more units while prices were depressed.
An FD investor putting the same ₹60,000 in over the same 6 months at, say, 7% annual interest would have earned roughly ₹1,400–₹2,000 in interest over that period — steady, certain, and completely disconnected from whatever the Sensex did. Use the SIP calculator and FD calculator to model your own crash scenario with different assumptions.
The Real Difference: Stayers vs Quitters
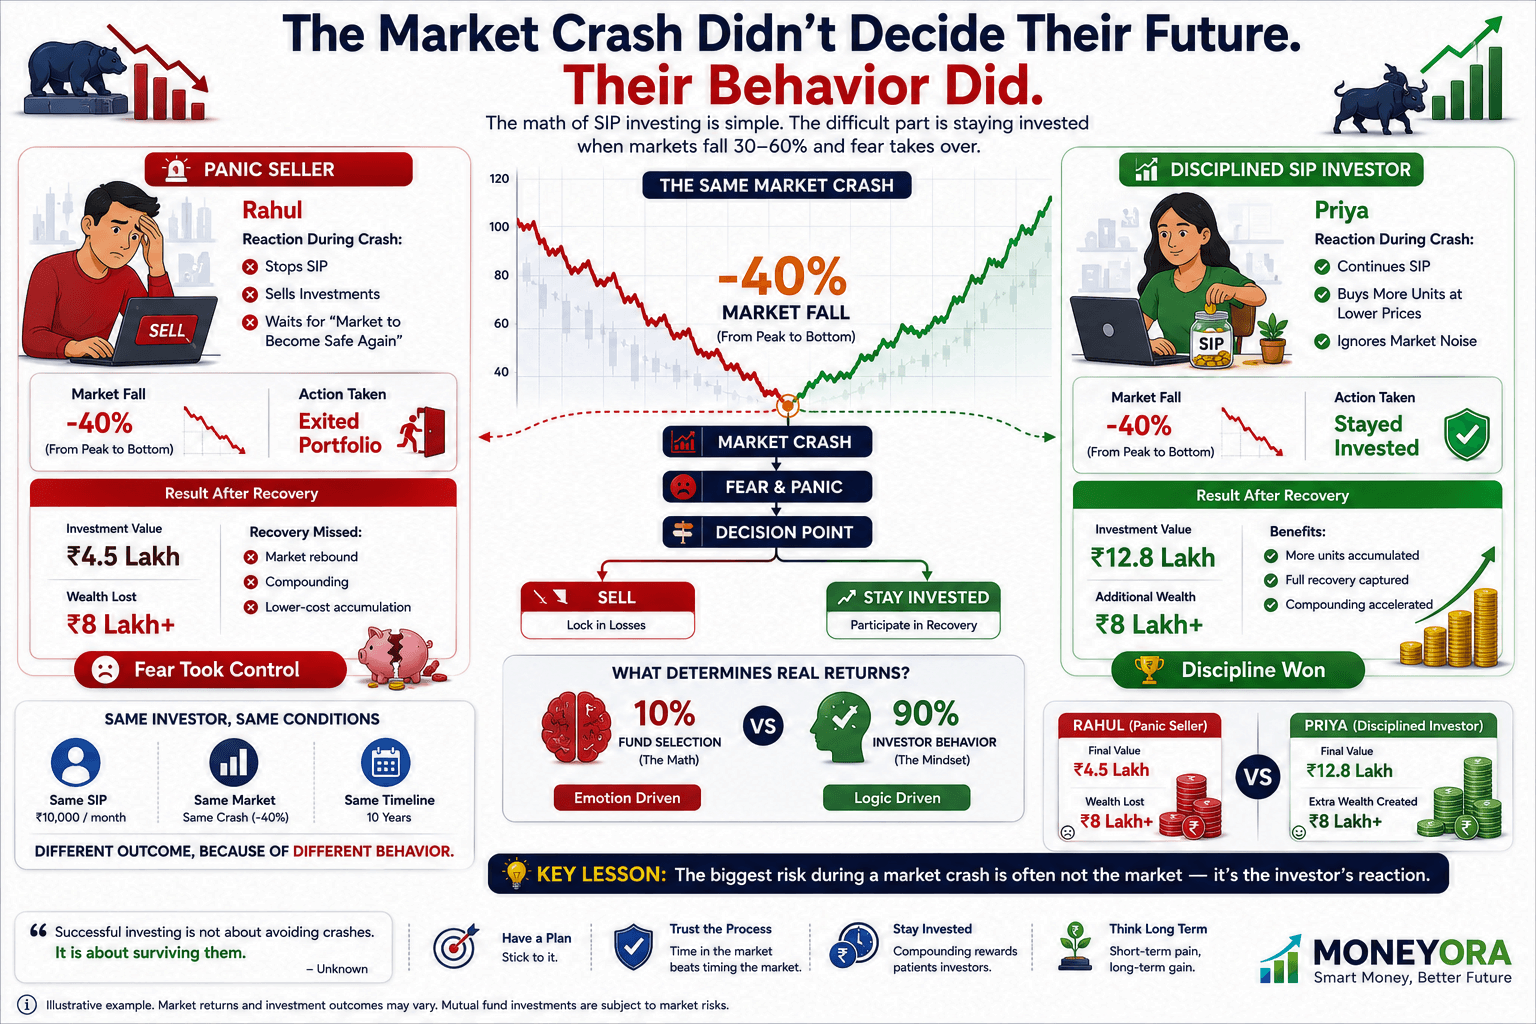
Industry data on Indian SIP investors shows that a large share stop their SIP or redeem entirely during market corrections — precisely the period when continuing would have helped them the most. This is not a minor footnote. It is arguably the single biggest factor separating the theoretical 12% CAGR quoted in every SIP vs FD comparison from what real investors actually experience.
This is the uncomfortable truth at the heart of every SIP vs FD debate during a crash: the FD’s “advantage” during the panic — that it does not move — is also exactly what makes it psychologically easy to hold. The SIP’s advantage — that crashes let you buy more units cheaply — only materialises for the investor who can tolerate watching the number go down for months without acting on the fear.
If you know, honestly, that you are the kind of investor who will panic and stop a SIP during a real crash, that self-knowledge matters more than any return projection. A guaranteed 7% FD you actually hold for 10 years can beat a theoretical 12% SIP you abandon at the worst possible moment.
Is FD Actually 100% Safe During a Crisis?
The instinct during a crash is to treat FD as the unambiguously safe option, and for the vast majority of retail FD holders, that is broadly true. But “safe” has a specific legal limit that most people never check.
FDs in India are protected by the Deposit Insurance and Credit Guarantee Corporation (DICGC), a wholly owned subsidiary of the Reserve Bank of India. DICGC insurance covers deposits up to ₹5 lakh per depositor per bank, combining both principal and accrued interest. If you hold ₹10 lakh in an FD with a single bank and that bank fails, only ₹5 lakh is guaranteed — the remaining ₹5 lakh is not automatically protected.
This does not mean FDs are unsafe in any practical sense — Indian bank failures affecting depositors are rare, and most FD holders will never need to think about this limit. But “FD is 100% safe” is a slight overstatement. The more accurate version: FD principal does not fluctuate with the stock market, and is protected up to a defined limit per bank, which is a meaningfully different and more precise claim.
| Factor | SIP (Equity Mutual Fund) | FD (Fixed Deposit) |
|---|---|---|
| Return during a crash | Negative on paper; NAV falls with market | Unaffected; fixed rate continues |
| Behaviour during a crash | More units bought per rupee (rupee cost averaging) | No change in accumulation mechanics |
| Long-term return potential | Higher — historically 10–14% CAGR over 10+ years | Lower — typically 6.5–7.5% fixed |
| Capital safety | Market risk; can lose value short-term | Protected up to ₹5 lakh per bank (DICGC) |
| Liquidity | High — redeem anytime (exit load may apply <1yr) | Lower — premature withdrawal penalty typical |
| Taxation | LTCG 12.5% above ₹1.25L gain (1yr+ holding) | Interest taxed at income slab rate annually |
| Minimum investment | As low as ₹500/month | ₹1,000–₹10,000 depending on bank |
| Best suited for | Goals 5+ years away; wealth creation | Goals 1–3 years away; capital protection |
| Behavioural requirement | High — must tolerate volatility without panic-selling | Low — no emotional management needed |
Track actual historical returns of any fund or FD you hold using MoneyOra’s stock return calculator and compare it against a guaranteed alternative using the CAGR calculator.
Decision Framework: When FD Actually Wins Over SIP
None of the data above means SIP is universally correct and FD is universally wrong. The SIP vs FD answer depends heavily on your specific situation — not just the historical averages.
Choose FD When:
- Your goal is less than 3 years away — a crash with no time to recover can leave you worse off than a guaranteed FD return
- You are building or holding an emergency fund — this money needs to be there regardless of what the market is doing
- You know from past experience that you panic and sell during downturns — a guaranteed 7% you actually keep beats a theoretical 12% you abandon
- You are within 1–2 years of needing the money for a fixed, non-negotiable expense (down payment, tuition fee, planned medical procedure)
Choose SIP When:
- Your goal is 5+ years away — retirement, children’s higher education, long-term wealth building
- You can genuinely commit to not checking and reacting to the portfolio value during a downturn
- You have already built a separate emergency fund in FD/savings, so a crash does not threaten your near-term cash needs
- You understand and accept that short-term losses are a normal, expected part of the journey toward long-term equity returns
For most financially disciplined investors, the realistic answer is not SIP vs FD as an either/or choice — it is both, serving different jobs in the same financial plan. FD or an RD for the money you need soon and cannot afford to lose. SIP for the money you will not touch for a decade or more. Use the lumpsum calculator if you are deciding between a one-time FD deposit versus a one-time equity investment for a specific goal.
Risks to Consider Before Choosing Between SIP and FD
Neither side of the SIP vs FD debate is risk-free. Here is the honest risk picture for each, so the comparison above does not read as more one-sided than it actually is.
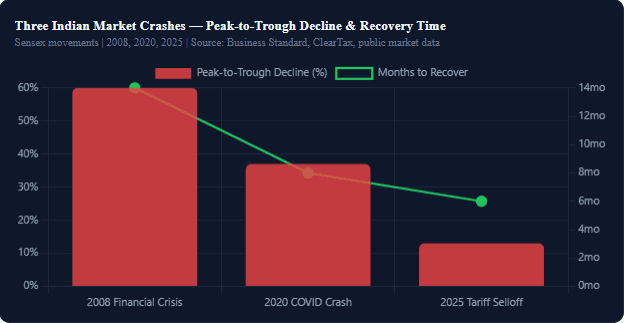
- Market risk (SIP): Equity mutual fund NAVs can stay depressed for longer than expected. The 2008-to-2009 recovery took roughly 14 months; a future crash could take longer, and there is no guarantee a recovery happens on any fixed timeline.
- Liquidity/behavioural risk (SIP): The returns shown in this article assume the investor does not redeem during the dip. If your actual behaviour is to sell when scared, the theoretical advantage of SIP largely disappears.
- Reinvestment risk (FD): When an FD matures during a low-interest-rate cycle, renewing it locks you into a lower rate for the next term — a risk that does not show up until renewal time.
- Inflation risk (FD): A 7% FD return, after tax at a 30% slab, nets roughly 4.9% — which can trail inflation in high-inflation years, quietly eroding real purchasing power even though the rupee balance never falls.
- Concentration risk (FD): As covered above, DICGC insurance caps at ₹5 lakh per bank. Large FD holdings concentrated in one bank carry uninsured exposure beyond that limit.
- Economic/sector risk (SIP): A crash driven by a structural issue (not just sentiment) can permanently impair some sectors or companies within a fund’s portfolio, even after the broader index recovers.
None of this is a reason to avoid either instrument — it is a reason to size each one according to what you can genuinely tolerate, not just what the historical average return suggests.
3 Mistakes Investors Make During a Market Crash
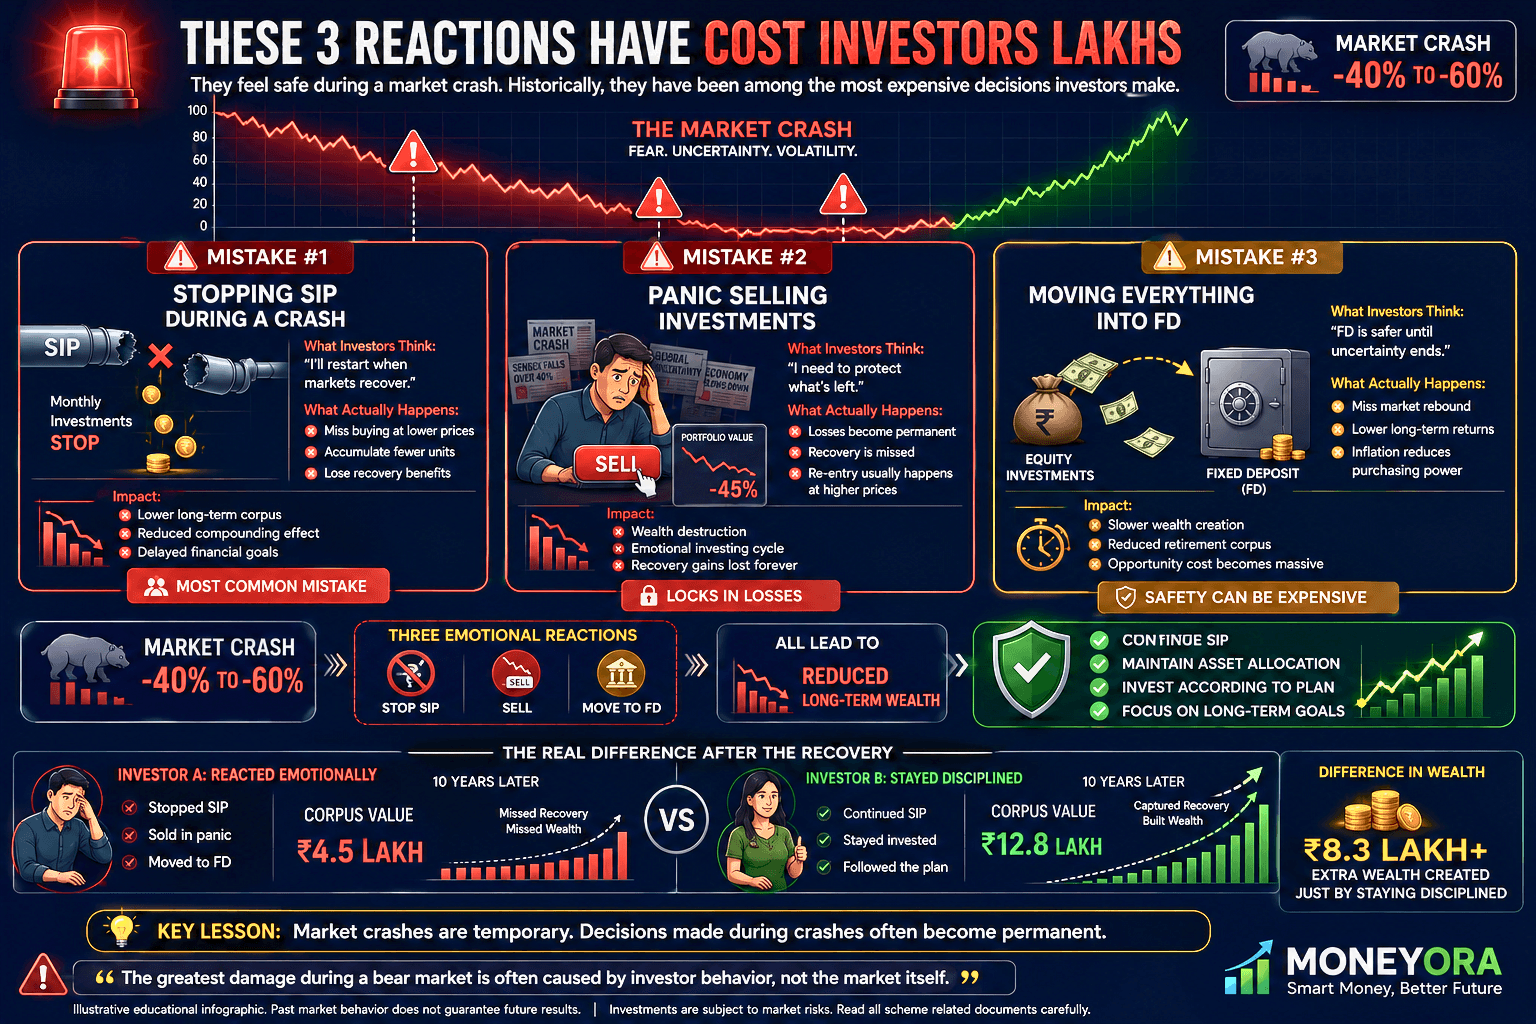
Mistake 1: Stopping the SIP “Until Things Stabilise”
This phrase sounds prudent. In practice, “until things stabilise” almost always means “until prices have already gone back up” — which is precisely the period that should have been bought into, not waited out. The 2020 example is the clearest illustration: investors who paused in March and April 2020 missed the cheapest NAVs of the decade.
Mistake 2: Moving the Entire Portfolio to FD Mid-Crash
Selling equity mutual fund units during a crash to move into FD converts a paper loss into a real, locked-in loss. The units sold at depressed NAVs are gone — you no longer benefit when the market recovers. This is functionally the opposite of what rupee cost averaging is designed to achieve, and it is one of the most expensive single decisions an investor can make during a downturn.
Mistake 3: Treating FD as a Permanent Strategy Rather Than a Temporary Shelter
Some investors, scared by one crash, move entirely to FD and never return to equity. Over a 20–30 year horizon, this trades a meaningfully higher expected return for the comfort of a flat line — a decision that can cost lakhs in foregone wealth by retirement, even though it feels safe in the short term. FD is an excellent tool for specific, near-term needs. It is a weaker tool for multi-decade wealth building precisely because it cannot benefit from the same compounding equity markets offer.
Calculate the long-term gap between an all-FD strategy and a balanced SIP + FD strategy using the SIP calculator alongside the FD calculator — run both for the same monthly amount and the same duration to see the real difference.
SIP vs FD Isn’t Really About Returns — It’s About What You Can Actually Hold
Every crash in India’s market history — 2008, 2020, 2025 — tells the same underlying story. SIP investors who kept investing through the panic bought meaningfully more units at lower prices, and that accumulation became the foundation of stronger long-term returns once markets recovered. FD investors earned their fixed rate the entire time, unaffected by any of it, trading upside for certainty.
Neither instrument is universally correct. The real determining factor in the SIP vs FD debate during a crash is rarely the return rate on paper — it is whether you can actually hold your position when your portfolio value drops 30–40% and every instinct says to stop.
If your money is needed soon, FD’s certainty is not a consolation prize — it is the correct tool for that job. If your money has a decade or more to work, the data from three separate Indian market crashes points the same direction: staying invested through the fall is usually what separates the investors who built real wealth from the ones who only ever talk about what they could have made. For the bigger emotional picture behind these decisions, our ₹100 per day investment guide and ₹25,000 salary investment plan cover the discipline side of staying invested long enough for any of this math to play out.
Use the Free Calculator Now on MoneyOra.in
Model your own SIP vs FD scenario — including conservative, crash-adjusted return assumptions — before you make your next decision.
Open SIP Calculator →
Use the free calculator now on MoneyOra.in — also explore our FD calculator, lumpsum calculator, RD calculator, and CAGR calculator for your complete financial planning toolkit.
Disclaimer: Historical market data and return figures cited in this article are illustrative and based on publicly available information. Mutual fund SIPs are subject to market risk; past performance does not guarantee future returns. FD returns depend on prevailing bank rates at the time of investment. This article is for informational purposes only and is not investment advice. Please consult a SEBI-registered investment advisor before making investment decisions.
- SIP Calculator — Project your SIP corpus at different CAGR assumptions, including conservative crash-adjusted scenarios
- FD Calculator — Calculate guaranteed FD maturity value for comparison
- RD Calculator — Model a recurring deposit as a hybrid between SIP discipline and FD safety
- Lumpsum Calculator — Compare a one-time FD deposit against a one-time equity investment
- CAGR Calculator — Calculate the actual annualised return of any investment across a crash-and-recovery period
- PPF Calculator — Model the tax-free, zero-volatility alternative alongside SIP and FD
- Stock Return Calculator — Track actual CAGR on direct equity holdings through a crash period
- SWP Calculator — Plan systematic withdrawals once your SIP corpus matures
Is SIP or FD better during a market crash?
For investors with a 5+ year horizon who continue investing through the crash, SIP historically outperforms FD because falling NAVs let you buy more mutual fund units at lower prices — rupee cost averaging. FD returns stay fixed regardless of the crash, which is safer for short-term goals, but produces lower long-term wealth than a SIP that is not stopped during the downturn.
Should I stop my SIP during a market crash?
No. Stopping a SIP during a crash is mathematically the worst time to stop, because falling NAVs mean your fixed monthly amount buys more units than usual. Industry data shows a significant share of SIP investors pause or redeem during corrections, missing exactly the period that historically drives the strongest long-term returns once markets recover.
What happened to SIP investors during the 2008 crash?
The Sensex fell over 60% from its January 2008 peak to its October 2008 low of around 8,701. SIP vs FD investors who continued investing monthly through the crash bought units at sharply reduced NAVs throughout 2008–2009. Those who stayed invested through the recovery saw their average purchase cost significantly lowered, resulting in stronger long-term returns than those who paused or exited.
What happened to SIP investors during the 2020 COVID crash?
The Sensex fell from around 41,000 in January 2020 to approximately 25,981 by late March 2020 — roughly a 37% drop. Investors who continued their SIP through March–May 2020 bought units at the year’s lowest NAVs. By November 2020, the Sensex had recovered to around 41,000, and investors who stayed invested saw meaningfully higher returns than those who paused contributions during the panic. SIP vs FD
Is FD completely safe during an economic crisis?
FDs are protected by the DICGC, a wholly owned RBI subsidiary, but only up to ₹5 lakh per depositor per bank, including principal and interest. If you hold an FD larger than ₹5 lakh at a single bank and that bank fails, the amount above ₹5 lakh is not guaranteed. SIP vs FD principal is otherwise protected from market volatility but is not entirely risk-free in extreme banking crisis scenarios.
What is rupee cost averaging and why does it matter during a crash?
Rupee cost averaging means investing a fixed amount at regular intervals regardless of price, so you automatically buy more units when NAVs are low and fewer when they are high. During a crash, NAVs fall sharply, so the same SIP vs FD amount buys significantly more units — units that become disproportionately valuable once the market recovers.
How much does panic-selling during a crash actually cost an investor?
Panic-selling locks in losses at the bottom and forfeits the recovery that typically follows. An investor who exits during a crash trough and re-enters later, after prices have partially recovered, buys fewer units at higher prices than someone who simply continued through the dip. Over a full market cycle, this behavioural gap can amount to lakhs of rupees in foregone returns on a meaningfulSIP vs FD portfolio.


Pingback: 100 Per Day Investment: How Wealth Can You Build - MoneyOra