PE Ratio Calculator: Calculate Stock Fair Value & P/E Ratio Online
A PE Ratio Calculator is the simplest tool to find if a stock is cheap or expensive.
You're looking at a stock. It's trading at ₹500. Your friend says it's cheap. But is it really?
Without knowing its PE ratio, you can't tell. "check today's share market PE levels before applying your calculator"
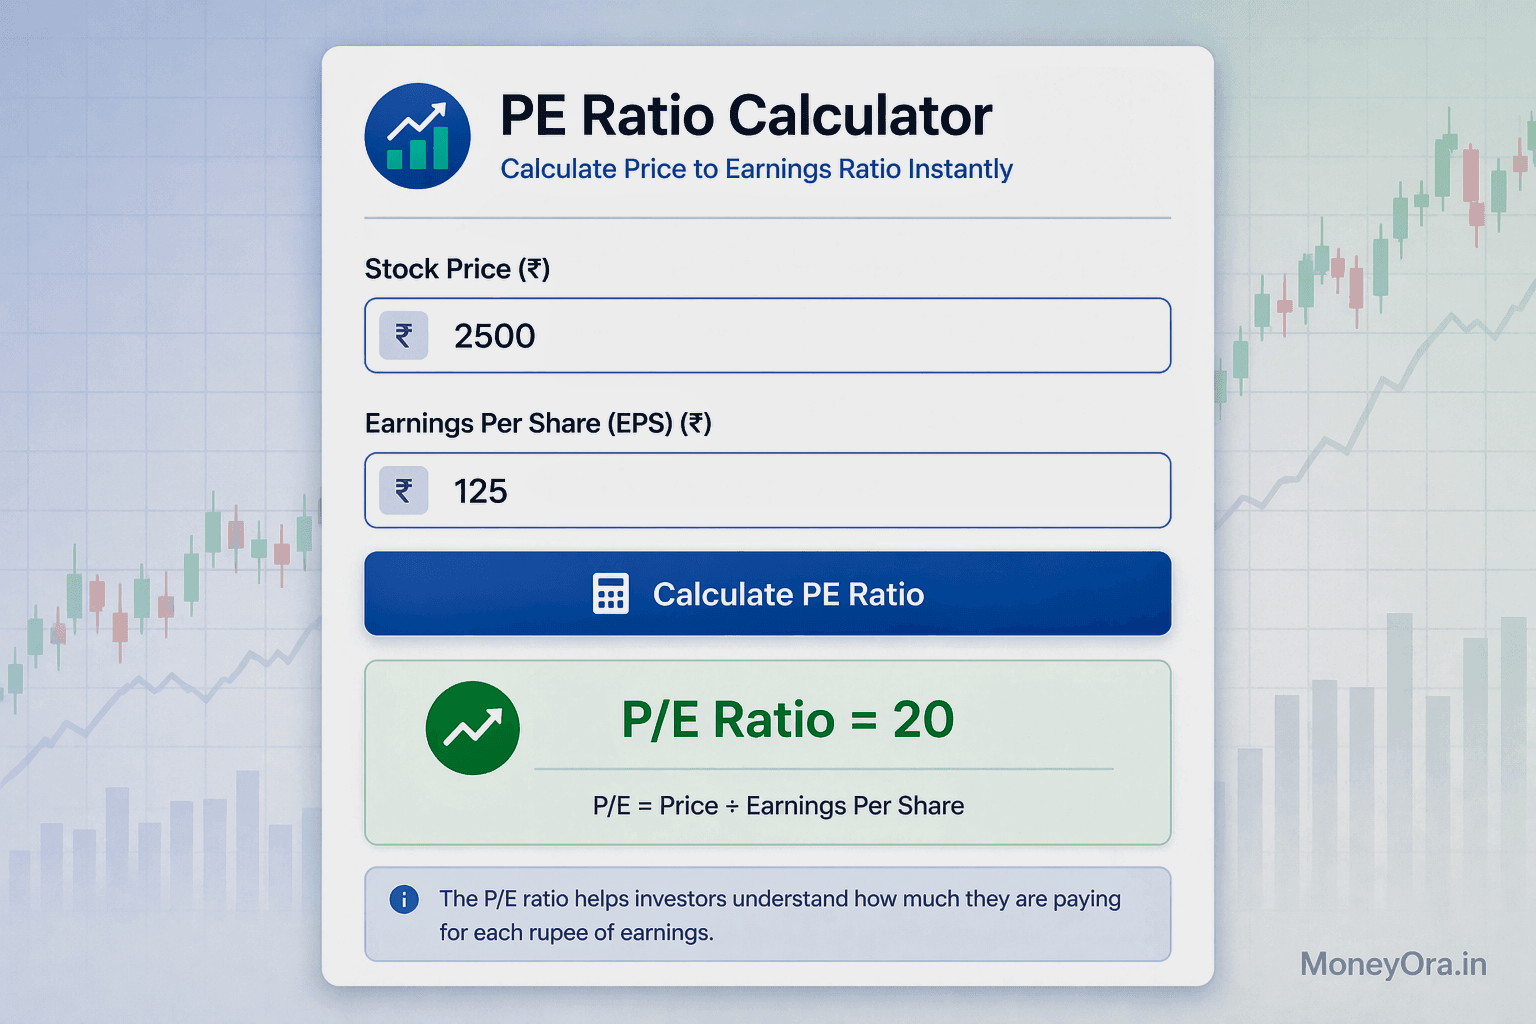
The PE Ratio Calculator answers this question instantly.
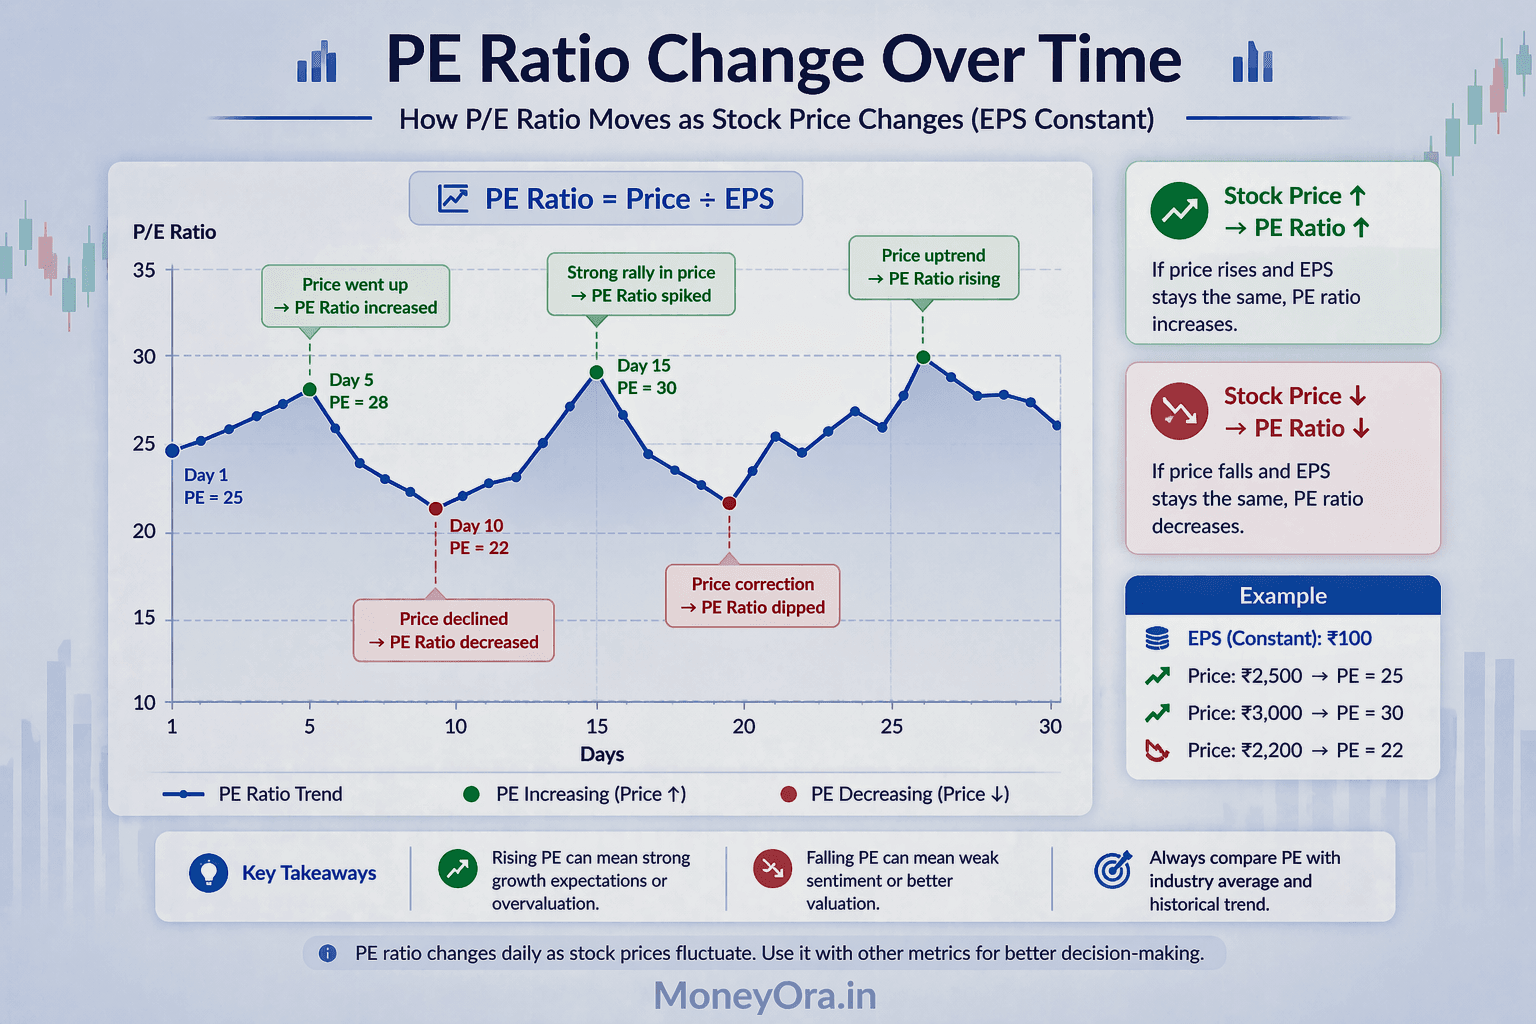
PE ratio—or price-earnings ratio—tells you if a stock is expensive or cheap compared to its earnings.
A PE Ratio Calculator lets you compute this in seconds instead of manual calculation.
When you know the stock's PE ratio, you know its real value.
You can compare it to other stocks. You can spot overpriced stocks before they crash.
Our free PE Ratio Calculator helps Indian stock traders and investors make smarter decisions.
Let's learn how the PE ratio calculator works and how to use it. "use PE ratio to evaluate India's top AI stocks"
What Is PE Ratio? Understanding Price-Earnings Ratio
The PE ratio (price-earnings ratio) is the simplest way to understand if a stock is expensive or cheap.
PE Ratio Formula:
PE Ratio = Stock Price ÷ Earnings Per Share (EPS)
That's it. Just two numbers.
Real Example:
Company XYZ stock price: ₹1,000 Company XYZ earnings per share (EPS):
₹100 PE Ratio = ₹1,000 ÷ ₹100 = 10
This means you're paying ₹10 for every ₹1 of earnings the company makes.
What Does This Mean?
A PE ratio of 10 means the stock would pay back your investment in 10 years (if earnings stay the same).
A PE ratio of 20 means 20 years to pay back.
A PE ratio of 5 means only 5 years.
Lower PE ratio = cheaper stock. Higher PE ratio = more expensive stock.
But there's a catch. Higher PE doesn't always mean bad. Sometimes high PE is justified.
Why Use a PE Ratio Calculator?
Manual calculation takes time. You need:
●Current stock price (easy to find)
●Earnings per share (need to look up)
●Divide them (mental math or calculator)
A PE ratio calculator automates this. Input the numbers, get the answer instantly.
Most Indian investors use a PE ratio calculator because it's fast and error-free.
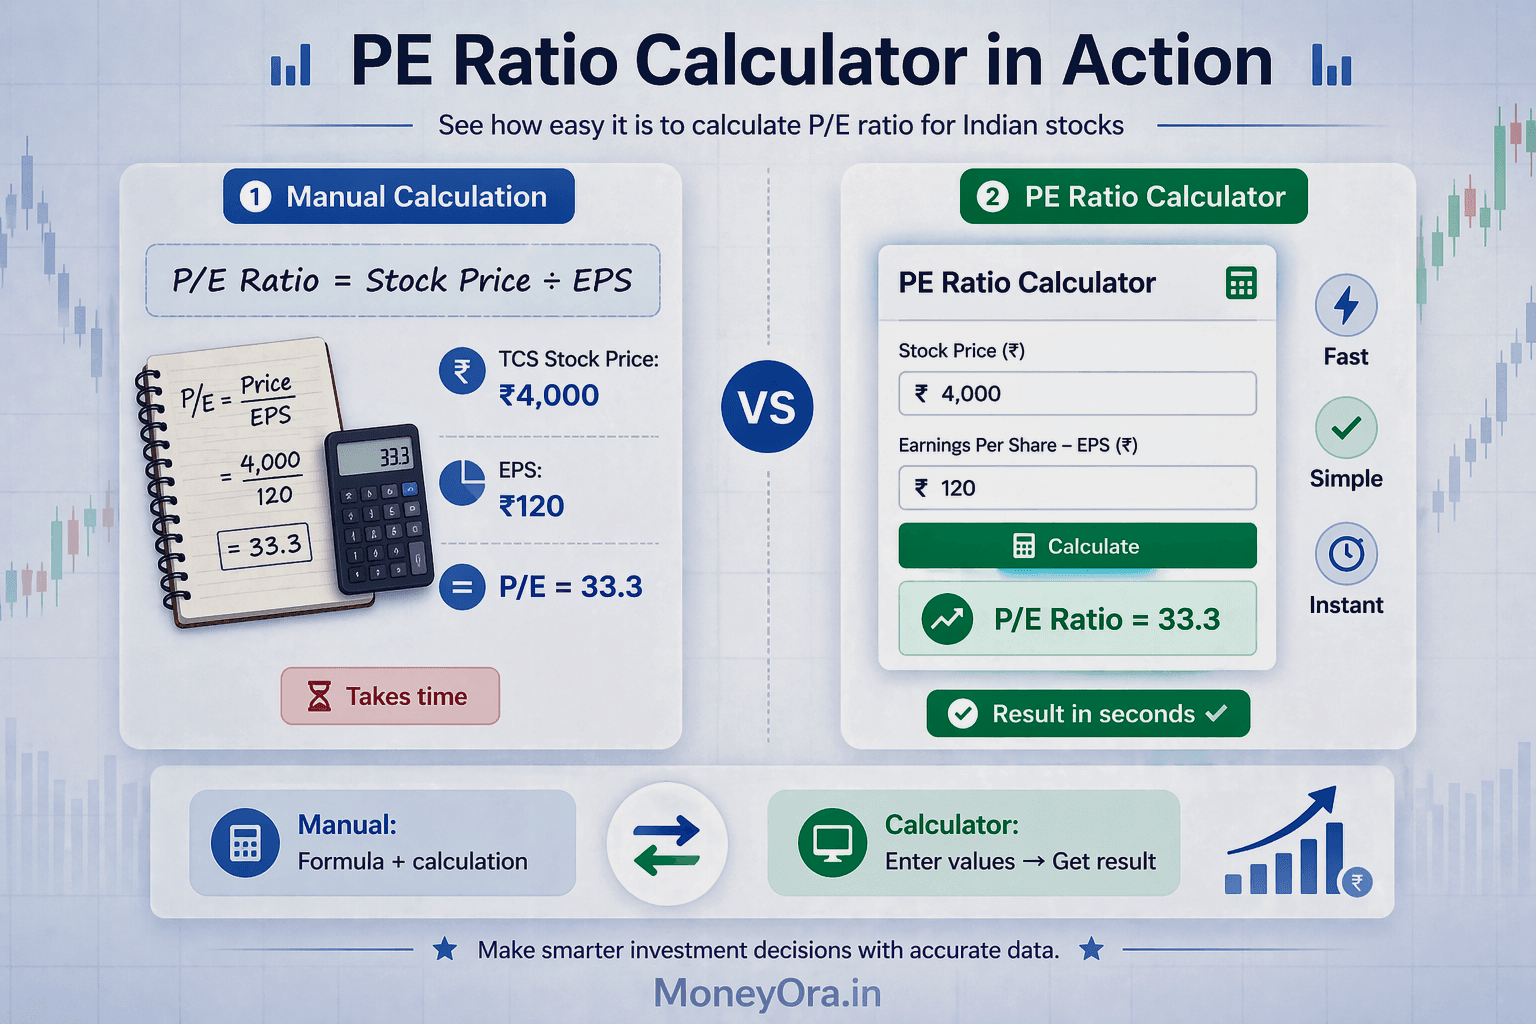
How to Calculate PE Ratio? Manual Method vs PE Ratio Calculator
Let's compare two methods: doing it manually and using a PE ratio calculator.
Manual PE Ratio Calculation (The Hard Way)
Step 1: Find the stock price.
●Easy. Just check NSE or BSE.
●Example: TCS stock = ₹3,500Step
2: Find earnings per share (EPS).
●Check the company's latest financial results.
●Look at "EPS" in the balance sheet or quarterly report.
●Example: TCS EPS = ₹350Step
3: Divide.
●₹3,500 ÷ ₹350 = 10
●PE Ratio = 10Step
4: Interpret.
●A PE of 10 means TCS is relatively cheap.
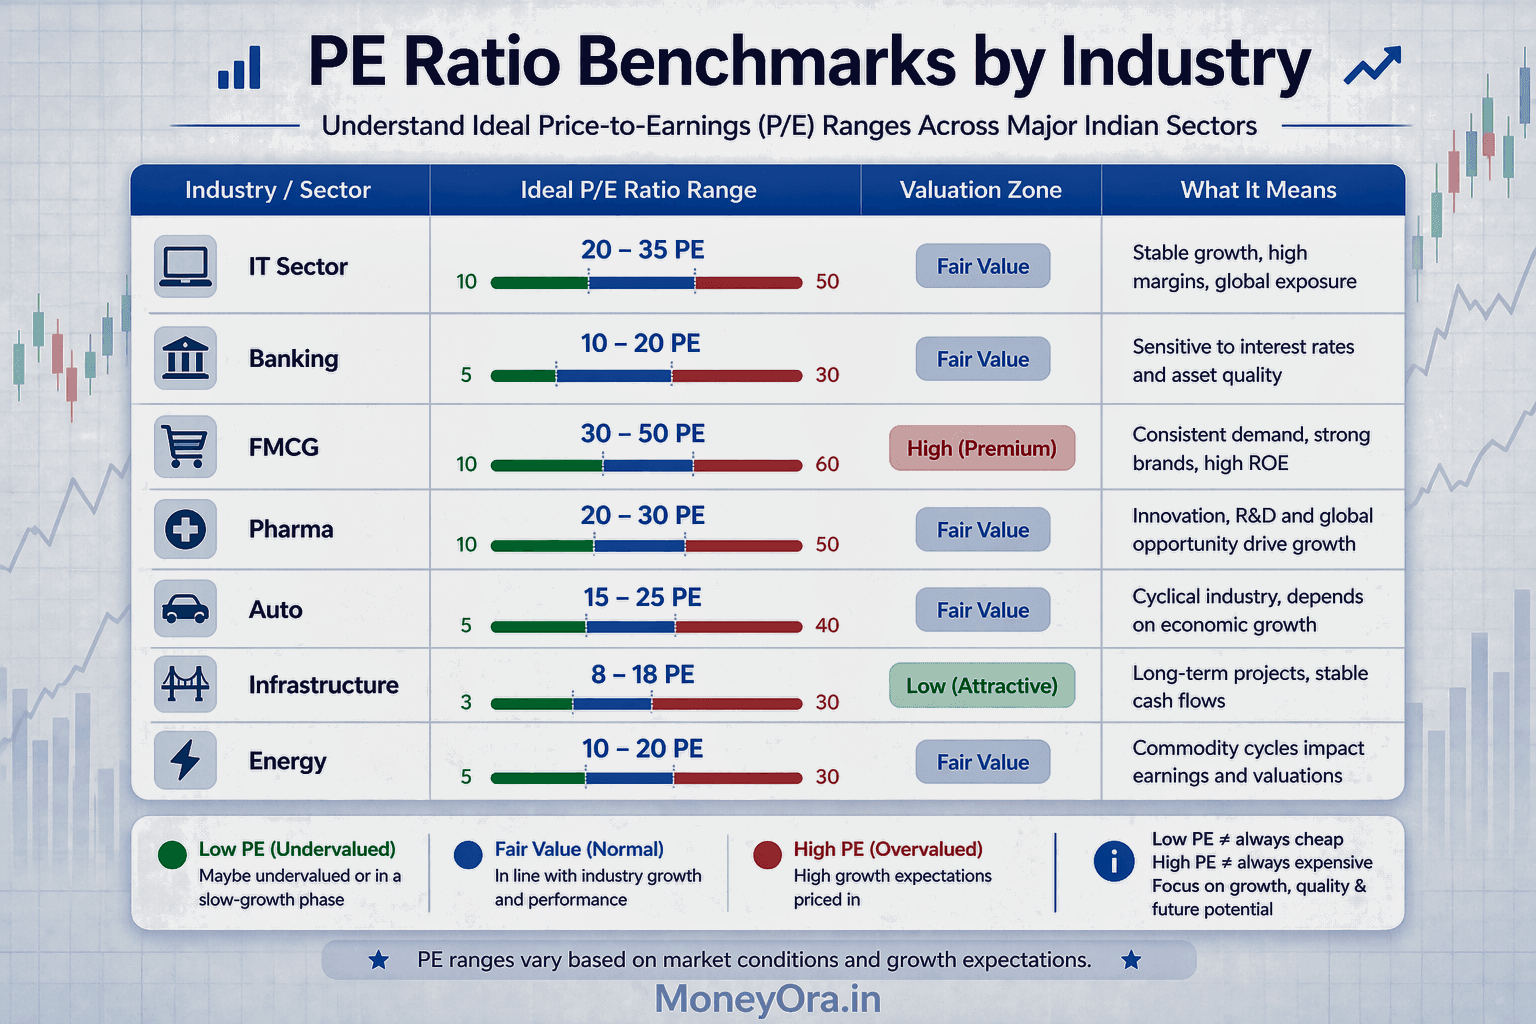
●Compare to industry average (IT sector average might be 15-20).
Time Taken: 5-10 minutes.
Accuracy Risk: Human calculation errors.
Comparison Time: Even longer if checking multiple stocks.
Using a PE Ratio Calculator (The Smart Way)
Step 1: Open PE ratio calculator.
Step 2: Enter stock price: ₹3,500
Step 3: Enter EPS: ₹350
Step 4: Click "Calculate"
Step 5: Instant result: PE Ratio = 10
Time Taken: 30 seconds.
Accuracy: Perfect (no human error).
Comparison Time: Can check 20 stocks in 10 minutes.
Why Use a PE Ratio Calculator?
●Faster than manual calculation
●No arithmetic errors
●Can compare multiple stocks quickly
●Most Indian brokers now offer PE ratio calculator tools
Professional investors always use a PE ratio calculator.


What Is a Good PE Ratio? Understanding Fair Value
Forward PE Ratio vs Trailing PE Ratio - Which to Use?
PE Ratio Calculator for Indian Stocks & Nifty 50